How do I get the CPU temperature?
Asked
Active
Viewed 2.0M times
21 Answers
827
Install lm-sensors
sudo apt-get install lm-sensors
After installation type the following in terminal
sudo sensors-detect
You may also need to run
sudo service kmod start
It will ask you few questions. Answer Yes for all of them. Finally to get your CPU temperature type sensors in your terminal.
sensors
Output:
$ sensors
coretemp-isa-0000
Adapter: ISA adapter
Core 0:      +41.0°C  (high = +78.0°C, crit = +100.0°C)
coretemp-isa-0001
Adapter: ISA adapter
Core 1:      +41.0°C  (high = +78.0°C, crit = +100.0°C)
w83627dhg-isa-0290
Adapter: ISA adapter
Vcore:       +1.10 V  (min =  +0.00 V, max =  +1.74 V)

in1:         +1.60 V  (min =  +1.68 V, max =  +1.44 V)   ALARM
AVCC:        +3.30 V  (min =  +2.98 V, max =  +3.63 V)

VCC:         +3.28 V  (min =  +2.98 V, max =  +3.63 V)

in4:         +1.85 V  (min =  +1.66 V, max =  +1.11 V)   ALARM
in5:         +1.26 V  (min =  +1.72 V, max =  +0.43 V)   ALARM
in6:         +0.09 V  (min =  +1.75 V, max =  +0.62 V)   ALARM
3VSB:        +3.30 V  (min =  +2.98 V, max =  +3.63 V)

Vbat:        +3.18 V  (min =  +2.70 V, max =  +3.30 V)

fan1:          0 RPM  (min = 10546 RPM, div = 128)  ALARM
fan2:        892 RPM  (min = 2136 RPM, div = 8)  ALARM
fan3:          0 RPM  (min = 10546 RPM, div = 128)  ALARM
fan4:          0 RPM  (min = 10546 RPM, div = 128)  ALARM
fan5:          0 RPM  (min = 10546 RPM, div = 128)  ALARM
temp1:       +36.0°C  (high = +63.0°C, hyst = +55.0°C)  sensor = diode
temp2:       +39.5°C  (high = +80.0°C, hyst = +75.0°C)  sensor = diode
temp3:      +119.0°C  (high = +80.0°C, hyst = +75.0°C)  ALARM  sensor = thermistor
cpu0_vid:   +2.050 V
To see HDD temperature, install hddtemp
sudo apt-get install hddtemp
Output:
$ sudo hddtemp /dev/sda
/dev/sda: ST3160813AS: 34°C
karthick87
- 84,513
259
Quick command-line solution; shows temperature in millidegrees Celsius (m°C)
cat /sys/class/thermal/thermal_zone*/temp
Applet
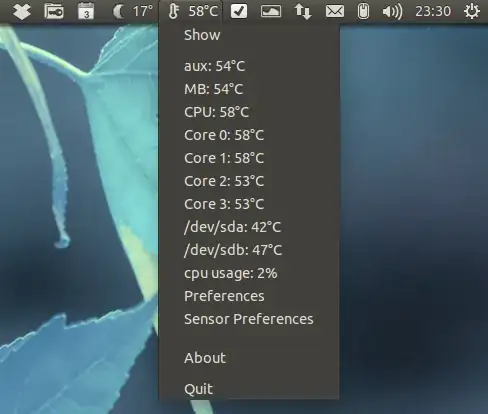
If you are looking for a easier-to-access version, add a Hardware Sensors Monitor to Gnome-Panel:
sudo apt-get install sensors-applet- this will install the sensors-applet package
Right-click the panel, select
Add to panel..., then select this: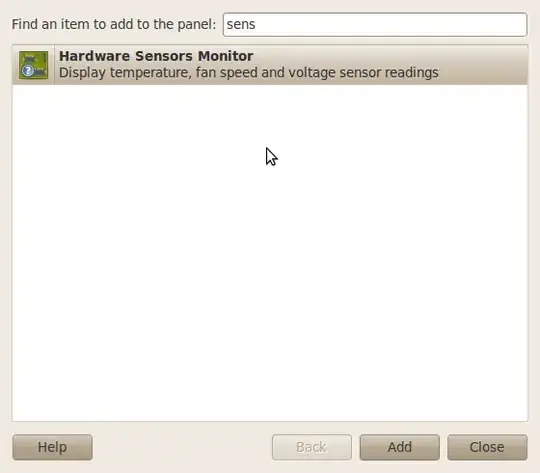
You're done. You can configure which sensors are displayed by right-clicking the applet and selecting
Preferences->Sensors.
Mihai Capotă
- 2,167
evgeny
- 9,865
170
Temperature without third-party apps
At the time of writing, all the answers involve use of third-party utilities. If you want to find out the temperature without installing anything, use:
$ cat /sys/class/thermal/thermal_zone*/temp
20000
53000
50000
53000
56000
68000
49000
50000
To see what zones the temperatures are referring to use:
$ paste <(cat /sys/class/thermal/thermal_zone*/type) <(cat /sys/class/thermal/thermal_zone*/temp) | column -s $'\t' -t | sed 's/\(.\)..$/.\1°C/'
INT3400 Thermal  20.0°C
SEN1             45.0°C
SEN2             51.0°C
SEN3             57.0°C
SEN4             59.0°C
pch_skylake      77.5°C
B0D4             50.0°C
x86_pkg_temp     51.0°C
The temperatures are stored in Celsius with 3 implied decimal places. sed is used to "prettify" output.
The last temperature is x86_pkg_temp reported at 54.0°C. For the Skylake i7 6700HQ CPU, I used this temperature for Conky display below.
Temperature with Conky
If you don't mind third-party utilities I like to use Conky--a light weight system monitor.
Conky commands
Within conky the system variable I used to monitor an Ivy Bridge CPU is:
${hwmon 2 temp 1}°C
To monitor a Skylake CPU I used:
${hwmon 0 temp 1}°C
Conky display
The conky display looks like this:

The temperature starts at 72°C with a single CPU running at 100% in turbo mode of 3200 MHz. Then turbo is switched off and temp drops 10°C to 62°C with a non-turbo speed of 2600 MHz. 10 seconds later turbo is turned back on and temperatures immediately spike back up to 72°C.
Controlling Temperature
After knowing your temperature you probably want to control it better. tlp works wonders for keeping system under control. It works with thermald, Intel Powerclamp, Battery vs AC for USB power, etc. Although highly configurable I've never had to change the configuration settings for a pleasant Out-Of-The-Box experience. Prior to using it I had all kinds of problems with an IvyBridge laptop overheating all the time. I have it on my new Skylake laptop and the fans NEVER run except when doing Ubuntu 16.04 LTS to 18.04 upgrade.
You can get a very detailed write-up with installation instructions here: Stop cpu from overheating
WinEunuuchs2Unix
- 105,762
156
A good indicator for monitoring temperature, fan speeds and voltage is psensor. It shows output of all sensors, draws graphs. Also selected outputs can be placed in indicator panel.
It can be installed from Ubuntu repositories by typing:
sudo apt-get install psensor
Newer versions of psensor can be installed from ppa:
sudo add-apt-repository ppa:jfi/ppa
sudo apt-get update
sudo apt-get install psensor
It can also draw graphs when you tick the boxes in the graph column:

Here is some information with more pictures.
In some cases not all sensors are displayed. Then you can run
sudo sensors-detect
and answer "yes" to all questions. But is not quite safe in some cases, but I never had any real problems with that. A safer way is to take default answers.
Some additional sensors may appear.
Thomas Ward
- 78,878
Pilot6
- 92,041
37
After you install lm-sensors:
sudo apt install lm-sensors
run:
sudo sensors-detect
you can run the following command to view hardware temps:
watch -n 1 sensors
Also, the fan is usually controled by BIOS.
Another good tool is i7z for Intel Core processors:
sudo apt install i7z
sudo i7z
and because i7z runs like top, there is no need to use watch.
mchid
- 44,904
- 8
- 102
- 162
26
XSensors
XSensors reads data from the libsensors library regarding hardware health such as temperature, voltage and fan speed and displays the information in a digital read-out.
To install XSensors in all currently supported versions of Ubuntu open the terminal and type:
sudo apt install xsensors lm-sensors
Then detect your computer's hardware sensors by opening the terminal and running the command:
sudo sensors-detect
Then you will get asked a lot of questions about what hardware you want the program to detect. It is generally safe and recommended to accept the default answers to all questions, unless you know what you're doing.
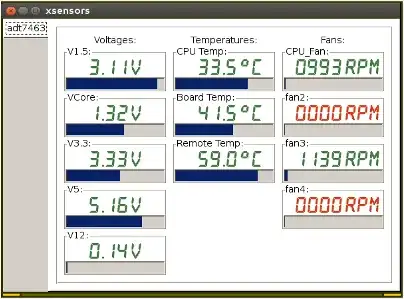
Xsensors vs. Psensor
XSensors and Psensor both monitor the computer's temperature and the fan speeds. The difference between the two applications is in the level of detail of the information that is displayed and how the information is displayed.
XSensors displays a little bit more specific information than Psensor. Psensor is smaller and more unobtrusive than XSensors and it displays itself on the desktop as a little thermometer icon in the notification area in the upper right corner of the desktop. You can right-click the thermometer icon at any time to display the hardware temperatures.
Setting up Psensor to detect your computer's hardware is done the same way as Xsensors, by installing lm-sensors to detect your computer's hardware sensors. Then detect your computer's hardware sensors running the command:
sudo sensors-detect
and as with Xsensors, accept the default answers to all questions.
In Ubuntu 16.04 and later Psensor detects your computer's hardware sensors automatically without running sudo sensors-detect
karel
- 122,292
- 133
- 301
- 332
14
On Raspberry Pi, you can retrieve the temperatureusing vcgencmd:
vcgencmd measure_temp
Output:
temp=39.0'C
BrokenBinary
- 103
- 5
Ercksen
- 303
12
All bash:
getTemp () {
  for zone in `ls /sys/class/thermal/ | grep thermal_zone`
  do
    echo -n "`cat /sys/class/thermal/$zone/type`: "
    echo `cat /sys/class/thermal/$zone/temp | sed 's/\(.\)..$/.\1°C/'`
  done
}

getProcesses() {
  top -b -n 1 | head -n 12  | tail -n 6
}

update () {
  while :
  do
    clear
    getTemp
    echo -e "\nTop 5 CPU hogs:"
    getProcesses
    sleep 5
  done
}


update
David Hamner
- 221
11
If you like Python, you can use psutil.
>>> import psutil
>>> psutil.sensors_temperatures()['coretemp']
[shwtemp(label='Physical id 0', current=67.0, high=100.0, critical=100.0), shwtemp(label='Core 0', current=67.0, high=100.0, critical=100.0), shwtemp(label='Core 1', current=65.0, high=100.0, critical=100.0)]
... will do the job. With a little coding, you can for example obtain the Temp vs CPU of your system.

It's convenient to update psutil by issuing sudo pip3 install psutil --upgrade.
Lucas Aimaretto
- 433
- 6
- 18
10
Just so you guys know, none of this install junk like sensors are needed. Just do an acpi -V and BOOM, you got everything. Example:
Battery 0: Charging, 91%, 00:17:25 until charged
Battery 0: design capacity 3310 mAh, last full capacity 3309 mAh = 99%
Adapter 0: on-line
Thermal 0: ok, 40.0 degrees C
Thermal 0: trip point 0 switches to mode critical at temperature 127.0 degrees C
Thermal 0: trip point 1 switches to mode hot at temperature 127.0 degrees C
Cooling 0: pkg-temp-0 no state information available
Cooling 1: LCD 0 of 100
Cooling 2: Processor 0 of 10
Cooling 3: Processor 0 of 10
Cooling 4: Processor 0 of 10
Cooling 5: Processor 0 of 10
WAY easier than installing all of this and kmod... Just do acpi -V.
lolzies
- 388
8
/sys/class/thermal/thermal_zone0/temp
this file holds cpu temperature.
So, you can make a script named temp and move it to /bin then in terminal enter temp.
My temp file looks like -
 #!/bin/bash
 cpu_temp=$(< /sys/class/thermal/thermal_zone0/temp)
 cpu_temp=$(($cpu_temp/1000))
 echo $cpu_temp°C
my answer is modified of www.cyberciti.biz
alhelal
- 2,741
6
One can also use bpytop. Install with:
sudo snap install bpytop
A more powerful version than htop, with CPU temperature and much more.
LoW
- 201
5
And here's my 2-cents on this matter. There's tmon, a very simple tool that reads the temperature while running another process, just like time, watch, timeout, etc...
tmon is a thin wrapper around /sys/class/thermal/thermal_zone*/temp, and can be useful when monitoring the temperature of your Linux computer/server while running CPU intensive processes: simulation, gaming, etc...
You can download the .AppImage "binary" from here: https://github.com/gmagno/tmon/releases and run it immediately and conveniently, that is:
Install
wget https://github.com/gmagno/tmon/releases/download/v0.3.7/tmon-a461481-x86_64.AppImage
chmod +x tmon*.AppImage
# optional: you may put it somewhere convenient in your file system and add a symlink in /usr/local/bin/tmon
or if you prefer:
pip install tmonpy
Usage
./tmon*.AppImage -h
Examples
./tmon*.AppImage echo "Quick programs return a single value of temperature"
Quick programs return a single value of temperature


===================
Temp Monitor Report:

   Temp (°C) for a period of 0:00:00
   >> 58.0 °C <<

   /tmp/tmon-20200207@16h07m05-znn0x1o9.txt
===================
./tmon*.AppImage bash -c 'echo not so quick ones will show a chart; sleep 6'
not so quick ones will show a chart


===================
Temp Monitor Report:

   Temp (°C) for a period of 0:00:06
   60.00  ┤
   59.86  ┤
   59.71  ┤
   59.57  ┤
   59.43  ┤
   59.29  ┤
   59.14  ┤
   59.00  ┼╮   ╭─
   58.86  ┤│   │
   58.71  ┤│   │
   58.57  ┤│   │
   58.43  ┤│   │
   58.29  ┤│   │
   58.14  ┤│   │
   58.00  ┤╰───╯

   >> min: 58.0 °C <<
   >> avg: 58.4 °C <<
   >> max: 59.0 °C <<

   /tmp/tmon-20200207@16h08m25-p010ojhq.txt
===================
you may also just run tmon without any arguments and it will run as you'd expect. Press Ctrl-C to terminate the process and get a temperature report
./tmon*.AppImage  # and wait a few seconds before pressing Ctrl-C
^C

===================
Temp Monitor Report:

   Temp (°C) for a period of 0:00:08
   60.00  ┤
   59.71  ┤
   59.43  ┤
   59.14  ┤
   58.86  ┤  ╭╮
   58.57  ┤  ││
   58.29  ┤  ││
   58.00  ┼╮╭╯│
   57.71  ┤││ │
   57.43  ┤││ │
   57.14  ┤││ │
   56.86  ┤╰╯ │
   56.57  ┤   │
   56.29  ┤   │
   56.00  ┤   ╰────

   >> min: 56.0 °C <<
   >> avg: 56.9 °C <<
   >> max: 59.0 °C <<

   /tmp/tmon-20200207@15h59m37-u4cd94qh.txt
===================
gmagno
- 215
3
There are a lot of different places you might find the temperature listed in millidegrees. I finally found mine here:
/sys/devices/platform/coretemp.0/temp*_input
Here are some other places users have reported to have found their temperature
/proc/acpi/thermal_zone/THRM/temperature
/sys/class/thermal/thermal_zone*/temp
/sys/class/thermal/cooling_device*/temp
/sys/devices/platform/f71882fg.1152/temp*_input
/sys/devices/platform/coretemp.0/hwmon/hwmon*/temp*_input
Some of these are just symbolic links to the others. You may have to look carefully to find it
Nacht
- 496
- 1
- 5
- 15
3
For Intel CPUs only You can use i7z.
i7z - A better i7 (and now i3, i5) reporting tool for Linux.
Install it :
sudo apt install i7z
Then run it (it has to be run with sudo):
sudo i7z
Example output (see Temp column - scroll right...):
Real Current Frequency 4883.47 MHz [99.98 x 48.85] (Max of below)
    Core [core-id]  :Actual Freq (Mult.)      C0%   Halt(C1)%  C3 %   C6 %  Temp      VCore
    Core 1 [0]:       4883.47 (48.85x)      10.4    73.7    1.45    12.8    47      1.3547
    Core 2 [1]:       4871.56 (48.73x)      8.65    76.8     1.5    11.7    45      1.3547
    Core 3 [2]:       4877.61 (48.79x)      12.2    75.1       1    9.72    52      1.3547
    Core 4 [3]:       4880.70 (48.82x)      7.57    79.7       1    10.5    47      1.3547
Michal Przybylowicz
- 3,972
2
printf '%d°\n' $(sensors | grep 'id 0:' | awk '{ print $4 }') 2>/dev/null
55°
printf '%d\n' Will convert the value to integer in case you need it as a round number
Sources: Linuxhacks.org
Disclosure: I am the owner of Linuxhacks.org
intika
- 924
2
If you are using Ubuntu with MATE Desktop Environment, you can use MATE Sensors Applet:
Install the package:
sudo apt-get install mate-sensors-appletAnd if you have Nvidia graphics card you can also install
mate-sensors-applet-nvidiapackage.Make right click on MATE Panel and click Add to Panel then choose Hardware Sensors Monitor

After adding you can setup it by doing right click on any sensor and selecting Preferences
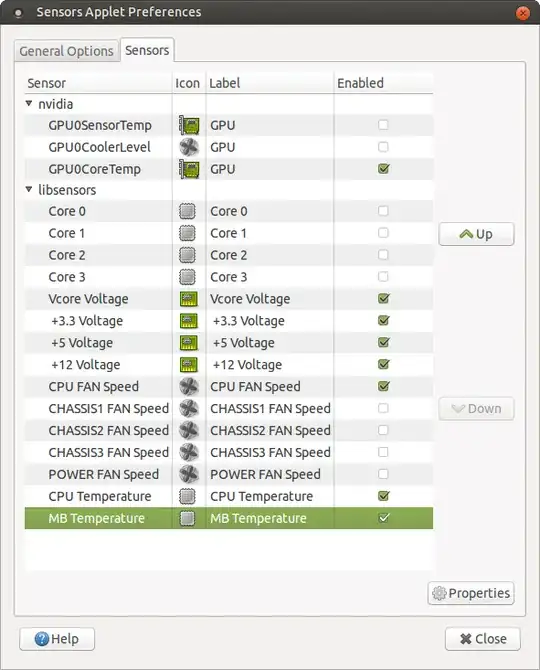
Here you can customize the list of sensors: CPU, Motherboard and GPU temperature, main voltages (Vcore, 3.3V, 5V, 12V, etc) and fan speeds. The full list depends on hardware (image above is for desktop with Nvidia graphics card).
The result will look like


Of course you can move this applet to the best location.
N0rbert
- 103,263
2
computertemp is a simple applet that shows your current CPU temperature + it has some additional features like alarms. Unfortunately it's not possible (or at least I don't know how) to change its background color, so it doesn't look very nice with the standard Ubuntu theme.
It can be installed the same way as the sensors-applet described in evgeny's answer.
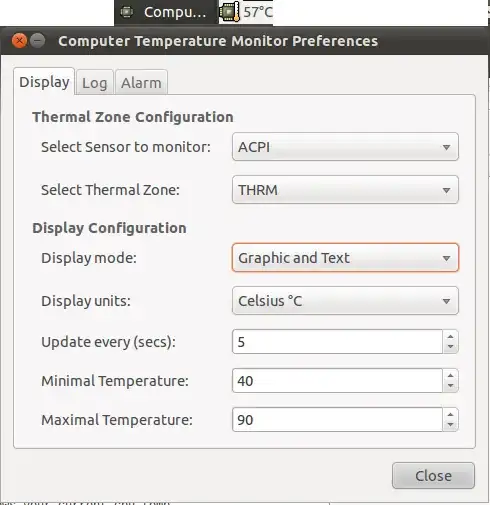
computertemp is not available in the newer Ubuntu repositories.