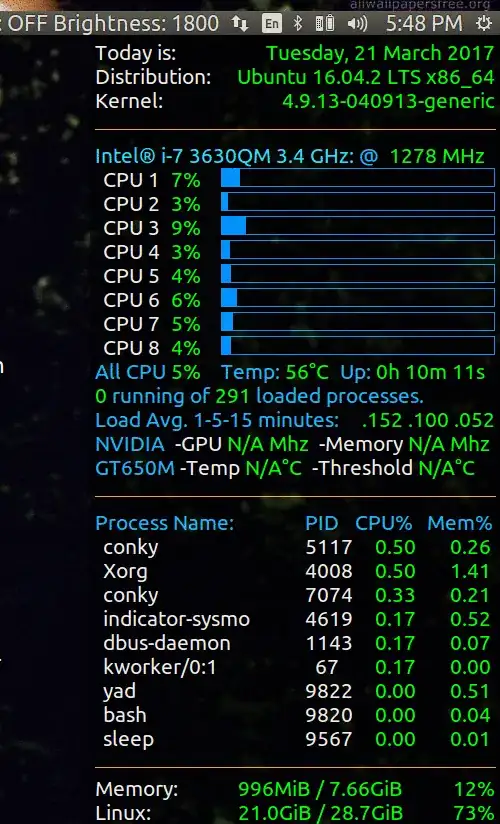
This 30 second gif shows Conky in action. For the first 15 seconds nothing is running and for the last 15 seconds Chrome is started up and you can see the CPU's spike as the 10 chrome tabs are reloaded from the last save.
The relevant code is:
TEXT ${color}Today is:${color green}$alignr${time %A,}$alignr ${time
%e %B %G} ${color}Distribution:${color green}$alignr ${pre_exec cat
/etc/issue.net} $machine ${color}Kernel:$alignr${color green} $kernel
${color orange}${voffset 2}${hr 1} ${color2}${voffset 5}Intel® i-7
3630QM 3.4 GHz: ${color1}@ ${color green}${freq} MHz
${color}${goto 13}CPU 1 ${goto 81}${color green}${cpu cpu1}% ${goto
131}${color3}${cpubar cpu1 18} ${color}${goto 13}CPU 2 ${goto
81}${color green}${cpu cpu2}% ${goto 131}${color3}${cpubar cpu2 18}
${color}${goto 13}CPU 3 ${goto 81}${color green}${cpu cpu3}% ${goto
131}${color3}${cpubar cpu3 18} ${color}${goto 13}CPU 4 ${goto
81}${color green}${cpu cpu4}% ${goto 131}${color3}${cpubar cpu4 18}
${color}${goto 13}CPU 5 ${goto 81}${color green}${cpu cpu5}% ${goto
131}${color3}${cpubar cpu5 18} ${color}${goto 13}CPU 6 ${goto
81}${color green}${cpu cpu6}% ${goto 131}${color3}${cpubar cpu6 18}
${color}${goto 13}CPU 7 ${goto 81}${color green}${cpu cpu7}% ${goto
131}${color3}${cpubar cpu7 18} ${color}${goto 13}CPU 8 ${goto
81}${color green}${cpu cpu8}% ${goto 131}${color3}${cpubar cpu8 18}
${color1}All CPU ${color green}${cpu}% ${goto 131}${color1}Temp:
${color green}${hwmon 2 temp 1}°C ${goto 250}${color1}Up: ${color
green}$uptime ${color green}$running_processes ${color1}running of
${color green}$processes ${color1}loaded processes. Load Avg. 1-5-15
minutes: ${alignr}${color green}${execpi .001 (awk '{printf "%s/",
$1}' /proc/loadavg; grep -c processor /proc/cpuinfo;) | bc -l | cut
-c1-4} ${execpi .001 (awk '{printf "%s/", $2}' /proc/loadavg; grep -c processor /proc/cpuinfo;) | bc -l | cut -c1-4} ${execpi .001 (awk
'{printf "%s/", $3}' /proc/loadavg; grep -c processor /proc/cpuinfo;)
| bc -l | cut -c1-4} ${color1}NVIDIA ${color}-GPU ${color
green}${nvidia gpufreq} Mhz ${color}-Memory ${color green}${nvidia
memfreq} Mhz ${color1}GT650M ${color}-Temp ${color green}${nvidia
temp}°C ${color}-Threshold ${color green}${nvidia threshold}°C
${color orange}${voffset 2}${hr 1} ${color1}${voffset 5}Process Name:
${goto 215}PID ${goto 265}CPU% ${goto 337}Mem% ${color}${goto 13}${top
name 1} ${goto 210}${top pid 1} ${goto 275}${color green}${top cpu 1}
${goto 350}${top mem 1} ${color}${goto 13}${top name 2} ${goto
210}${top pid 2} ${goto 275}${color green}${top cpu 2} ${goto
350}${top mem 2} ${color}${goto 13}${top name 3} ${goto 210}${top pid
3} ${goto 275}${color green}${top cpu 3} ${goto 350}${top mem 3}
${color}${goto 13}${top name 4} ${goto 210}${top pid 4} ${goto
275}${color green}${top cpu 4} ${goto 350}${top mem 4} ${color}${goto
13}${top name 5} ${goto 210}${top pid 5} ${goto 275}${color
green}${top cpu 5} ${goto 350}${top mem 5} ${color}${goto 13}${top
name 6} ${goto 210}${top pid 6} ${goto 275}${color green}${top cpu 6}
${goto 350}${top mem 6} ${color}${goto 13}${top name 7} ${goto
210}${top pid 7} ${goto 275}${color green}${top cpu 7} ${goto
350}${top mem 7} ${color}${goto 13}${top name 8} ${goto 210}${top pid
8} ${goto 275}${color green}${top cpu 8} ${goto 350}${top mem 8}
${color}${goto 13}${top name 9} ${goto 210}${top pid 9} ${goto
275}${color green}${top cpu 9} ${goto 350}${top mem 9} ${color
orange}${voffset 2}${hr 1} ${color}Memory:${goto 148}${color
green}$mem / $memmax $alignr${color green}${memperc /}%
${color}Linux:${goto 148}${color green}${fs_used /} / ${fs_size /}
$alignr${color green}${fs_used_perc /}%
Sorry for posting as "Quote" if I posted as "Code block" it would be one long line.
As far as using Conky in 16.04 / 16.10 most people have success with older version used in 14.04 as per this Q&A (Ubuntu 16.04 apt-get doesn't provide conky-all from Ubuntu 14.04)
If you want to learn more about Conky and get some cool scripts written by others here are 3,000 messages: ( Post your .conkyrc files w/ screenshots) spanning a decade and plus change.
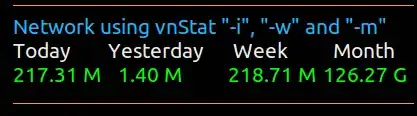
Sorry I don't have the network speed line graph going on this display. I used to have it in the old days (2014) when I was concerned about speed as you are now. I did recently setup a tally of how much bandwidth was consumed in a month for billing purposes:
Instructions for this are described in a variety of Q&A's here:
(Any good application for data usage monitor?) and here:
(How can you monitor internet data usage?) and here: (How to track the total network data in a month). All three answers look about the same.
Let me know if you need to see the network speed bar graph and I'll modify my Conky to show that and include the code.

