In Peskin & Schroeder's book, they introduce the linear sigma model with a Lagrangian (chapter 11.1,p349)
$$ L = \frac{1}{2} (\partial_\mu \phi^i)^2 + \frac{1}{2} \mu^2 (\phi^i)^2 - \frac{\lambda}{4} \left[ (\phi^i)^2 \right]^2.\tag{11.5} $$
Taking the minimum of the corresponding Hamiltonian to derive the lowest-energy classical configuration and define a set of shifted fields from the classical confuguration, they derive the lagrangian for linear sigma model in terms of $\sigma$ field and $\pi$ field (chapter 11.1,p350):
\begin{align} L &= \frac{1}{2} (\partial_\mu \pi^k)^2 + \frac{1}{2} (\partial_\mu \sigma)^2 - \frac{1}{2} (2\mu^2) \sigma^2 \notag \\ &\quad - \sqrt{\lambda} \mu \sigma^3 - \sqrt{\lambda} \mu (\pi^k)^2 \sigma - \frac{\lambda}{4} \sigma^4 - \frac{\lambda}{2} (\pi^k)^2 \sigma^2 - \frac{\lambda}{4} \left[ (\pi^k)^2 \right]^2 \tag{11.9} \end{align}
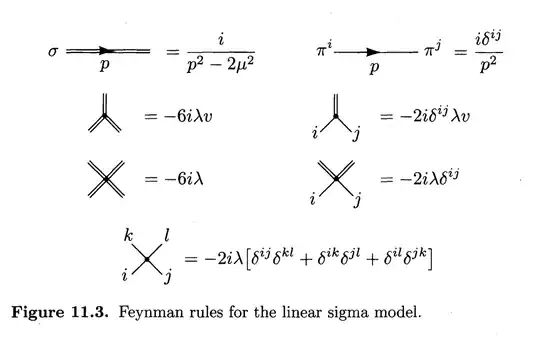
and this give rise of a set of feynman rules shown in the figure 11.3:
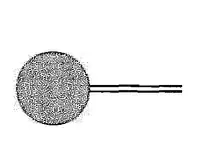
Then they proceed to state(p355) that the tadpole diagram (the figure below) produce a vacuum expectation of $\sigma$, the exact quote goes like:
This amplitude produces a vacuum expectation value of $\sigma$ and so, since $\phi^N=v+\sigma$, shifts the vacuum expectation value of $\sigma$. Such a shift is quite acceptable, as long as it is finite after counterterms are properly added into the computation of the amplitude.
The figure for tadpole diagram:
My question is: Why this tadpole diagram represent the vacuum expectation value of $\sigma$ field? I fail to understand it intuitively.
I have read this post but I still couldn't understand it because I don't understand how the vacuum expectation value is related to the tadpole diagram shown in my figure. I have also read this post but this does not answer how the vacuum expectation value is related to the tadpole Feynman diagram.

