I heard Michelson Interferometers produce patterns on the screen I know the explanation of pattern produced by young's double slit experiment. So, from my knowledge if the lights are parallel and coherent then cancellation or adding should take place showing uniform intensity. As I think in Michelson Interferometers lights are parallel. So why is it showing pattern.
Asked
Active
Viewed 132 times
1 Answers
1
Let us consider the simples description of the Young's two-slit experiment (image source):
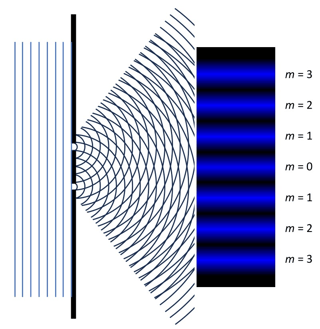
Suppose the slits are positioned at points $\mathbf{r}_1=(0,-d/2),\mathbf{r}_2=(0, d/2)$, whereas the points on the screen are given by $\mathbf{r} =(x_s, y)$. The field at any point at the screen is formed by adding the two waves arriving from the slits: $$ \mathbf{E}(\mathbf{r},t)=\mathbf{E}_1\cos(k |\mathbf{r} -\mathbf{r}_1|-\omega t) + \mathbf{E}_2\cos(k |\mathbf{r} -\mathbf{r}_2|-\omega t), $$
The intensity measured on the screen (e.g., using a photo-detector or a photographic film) is the magnitude squared of the field averaged over many cycles of the optical frequency: $$ I(\mathbf{r}) = \lim_{T\rightarrow +\infty}\frac{1}{T}\int_0^{T}dt |\mathbf{E}(\mathbf{r},t)|^2= \lim_{T\rightarrow +\infty}\frac{1}{T}\int_0^{T}dt |\mathbf{E}_1\cos(k |\mathbf{r} -\mathbf{r}_1|-\omega t) + \mathbf{E}_2\cos(k |\mathbf{r} -\mathbf{r}_2|-\omega t)|^2=\\ \lim_{T\rightarrow +\infty}\frac{1}{T}\int_0^{T}dt \left[|\mathbf{E}_1|^2\cos^2(k |\mathbf{r} -\mathbf{r}_1|-\omega t) + |\mathbf{E}_2|^2\cos^2(k |\mathbf{r} -\mathbf{r}_2|-\omega t)+\\ 2\mathbf{E}_1\cdot\mathbf{E}_2\cos(k |\mathbf{r} -\mathbf{r}_1|-\omega t)\cos(k |\mathbf{r} -\mathbf{r}_2|-\omega t)\right] $$ After using the trigonometric formulas for the square of the cosine and the product of cosines: $$ \cos^2\alpha = \frac{1}{2}\left[\cos\left(2\alpha\right)+1\right],\\ \cos\alpha\cos\beta = \frac{1}{2}\left[\cos\left(\alpha+\beta\right)+\cos\left(\alpha-\beta\right)\right], $$ and taking into account that $$ \lim_{T\rightarrow +\infty}\frac{1}{T}\int_0^{T}dt\cos(\theta - 2\omega t)\rightarrow 0 , $$ we arrive at something like $$ I(\mathbf{r})= \frac{|\mathbf{E}_1|^2}{2} + \frac{|\mathbf{E}_2|^2}{2}+ 2\mathbf{E}_1\cdot\mathbf{E}_2\cos\left(k |\mathbf{r} -\mathbf{r}_1|-k |\mathbf{r} -\mathbf{r}_2|\right) $$ The first two terms are constant, whereas the last one oscillates as we move along the screen: $$ k |\mathbf{r} -\mathbf{r}_1|-k |\mathbf{r} -\mathbf{r}_2|= k\sqrt{x_s^2+(y+d/2)^2}-k\sqrt{x_s^2+(y-d/2)^2} \approx k\sqrt{x_s^2+y^2+yd}-k\sqrt{x_s^2+y^2-yd} \approx \frac{kyd}{\sqrt{x_s^2+y^2}} \approx \frac{kyd}{x_s}\\ I(\mathbf{r})\sim 2\mathbf{E}_1\cdot\mathbf{E}_2\cos\left(\frac{kyd}{x_s}\right) $$ (I assume for the sake of clarity of presentation that the slits are close to each other and that the screen is very far, that is $x_S\gg |y|, d$.)
Thus, we obtain the interference pattern.
In more simple terms - the interference pattern arises from the variation of the relative phase between the added waves as we move along the screen. With appropriate adjustments this reasoning works for other interferometers. The important point here is that waves are not added at one point, but at many different points (of a photographic plate or when moving a detector.)
A rather special case is so-called Fourier-transform spectroscopy, where instead of exploring the interference pattern in space one moves a mirror of the interferometer and records the change of the intensity in time.
Roger V.
- 68,984