2

I am currently running a numerical simulation for site percolation. Using periodic boundary conditions I am attempting to determine the correlation length following the method set out in this paper https://arxiv.org/pdf/1902.03708.pdf.

The Figure below shows the results of the simulation for different values of the lattice length L. enter image description here
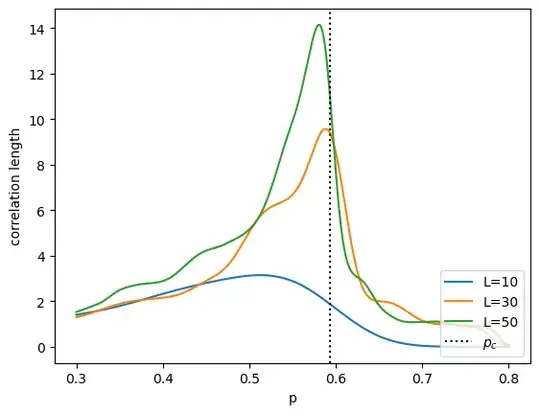
While the correlation length follows the expected shape, it seems to peak at lower values than expected. Near the percolation threshold the correlation should approach L - though this feature is not present in my simulation.

Question: Is this a feature of the correlation length for numerical simulations or is there an issue with my simulation? I.e. have I made a mistake in the program?

Edit:

This simulation is for simple site percolation on a 2D lattice. I am using the Newman-Ziff algorithm https://arxiv.org/pdf/cond-mat/0101295.pdf. The plot for the correlation length was generated from the average of 10 samples. I have also attached a visualization of the clusters at different steps in simulation for L=50.

enter image description here

The following definition for the correlation length is used:

$$ \xi^2 = \frac{\sum_\mu{m_\mu I_\mu}}{\sum_\mu{m_\mu^2}}$$ The sums are over all clusters (excluding the one that has percolated). $m_\mu$ is the size of cluster $\mu$ and $I_\mu$ is the moment of inertia: $$I_\mu=\sum_i^{m_\mu}(x_i-x'_\mu)^2$$ I.e. the sum of the squared differences between the cluster sites and the center of mass.

The procedure for finding the correlation length then involves tracking the moments of inertia and center of masses as the sites are added.

jore1
  • 99

1 Answers1

3

@jore1, thanks for the edits,

The shown data is reasonable and consistent with the expected percolation picture. The divergence of the correlation length can be observed in the infinite lattice only. On finite lattice of size $L$, the correlation length never exceeds $L$ and approaches $\sim L$ near the threshold. The same picture is observed in the plot.

One feature in the presented data caused suspicion at first glance: the maximum value of the correlation length is considerably smaller than $L$. To verify that this is reasonable, let me make an estimate for the correlation length (according to the definition from the question) near the threshold.

Assume that near the threshold, there is only one large connected cluster ($\mu = 1$) which occupies almost all sites but does not percolate. Therefore, it gives the dominant contribution into the correlation length: \begin{equation} \xi_{est}^2 = \frac{I_1}{m_1}, \end{equation} where \begin{equation} I_1 = \sum_{i} (x_i - x_1')^2. \end{equation} As the cluster occupies almost all lattice sites, the sum in $I_1$ can be replaced by an integral over the square. It results in \begin{equation} \xi_{est}^2 = \int_{-L/2}^{L/2}dx\int_{-L/2}^{L/2}dy (x^2 + y^2) = L^2/6, \end{equation} so $\xi_{est} = L/\sqrt{6} \approx 0.41 L$. For the values used in your simulation $L = 10, 30, 50$, the estimate for the correlation length is $\xi_{est} \approx 4, 12, 20$ correspondingly. It is less than $L$ and even close to the observed maximum values, although the approximation used for the estimate is quite rough.

To conclude, numerical data match the analytical estimates and the expected percolation picture. I am not 100% sure about the discrepancy between the numerical and theoretical threshold probabilities, but it is likely to happen because of numerical issues, e.g., finite lattice size and finite (and quite low) number of samples. I modeled percolation some time ago, and my threshold probability was close but not exactly equal to the theoretical value.

E. Anikin
  • 1,123