2

Naively, when the water cools down to low temperature, the water goes to the ice solid phase. (Like below 0 celsius at 1 ATM pressure.)

Can water remain in the gas form at zero Kelvin (0K) temperature, when the pressure is low enough?

Namely,

  1. Can the water vapor (gas) phase persist at a zero Kelvin (0K) temperature, when the pressure is low enough?

According to the first phase diagram in Celsius, it cannot tell.

According to the second phase diagram in Kelvin to near 0K, it seems the answer is no.

  1. What is the nature of the quantum phase transition at zero Kelvin (0K) between the water solid (ice) and the water gas phase (vapor)? (the first or second order or continuous higher phase transitions, Ginzburg-Landau potential, etc.)
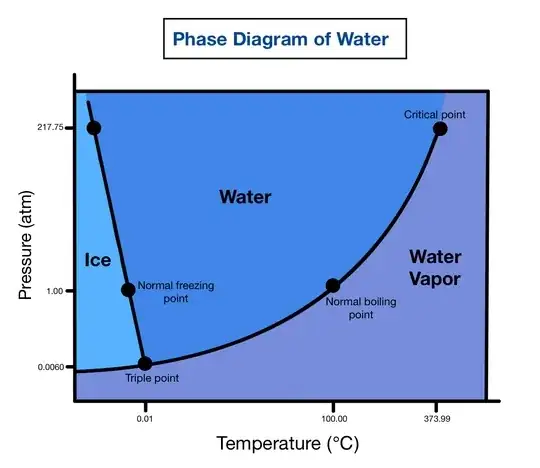
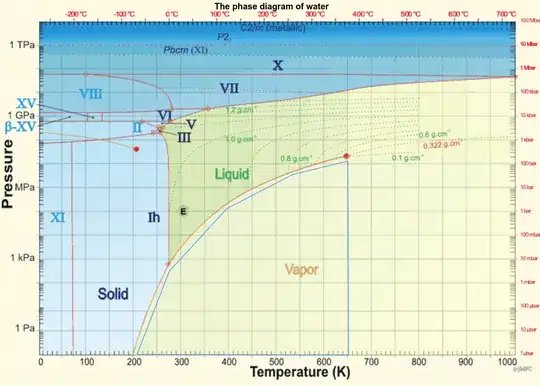
enter image description here

enter image description here

wonderich
  • 8,086

3 Answers3

1

If the pressure is very low, the molecules might be simply too far from each other to form bonds and reduce their energy via binding. This means, we will just have a bunch of molecules at large distances from each other, performing zero point oscillations.

Bringing molecules closer to each other then may allow them to bind... I am however not sure, whether this qualifies as a phase transition (quantum or not), since in this case it is accompanied by energy release: it is more like a chemical reaction in this case, crystallization reaction?

Seems somewhat similar to Wigner crystallization, where the transition is driven by the electron density.

Roger V.
  • 68,984
1

According to the second phase diagram in Kelvin to near 0K, it seems the answer is no.

Then I think you must be misreading the diagram, as I don't see any section where the vapor pressure is identically 0 Pa. (It drops exponentially with cooling, to be sure.)

In fact, the vapor pressure will never drop to exactly zero regardless of the amount of cooling because the release of the first molecule from the condensed phase into the gas phase provides, at minimal energy cost, a tremendous increase in entropy (specifically, positional entropy), which Nature loves.

-2

As a citizen, I have a duty to say something if I see a problem, probably because we all have to do our small part in order for us to still have a plan 100 years later. I believe the second phase diagram is right and the first one is God knows what? I found the first phase diagram on the web page https://www.expii.com/t/phase-change-diagram-of-water-overview-importance-8031. Maybe the first one was a zoomed in image from a textbook where it was clear from the context what they meant and that the axes were not zero. But that website is recklessly talking and putting too much responsibility onto society to figure out the facts from what they're saying. How is society gonna do that? Some people as their small part of working towards a plan 100 years later, might decide to filter out information about unsourced material such as the first phase diagram and think independently using only information internal to their job environment. Maybe we could use a plan 10 years from now where Physics Stack Exchange and possibly most of the Stack Exchange websites don't rely on that stuff.

It was like 10 years ago that I finished university. I remember there was a vapour pressure and temperature formula. I might still have the text book but I prefer to get it from https://www.wikihow.com/Calculate-Vapor-Pressure#:~:text=To%20find%20the%20vapor%20pressure,solution%3DPsolventXsolvent. which I got through a Google search. The ability for me to think of searching that might have come from me remembering that there was a formula. I will repeat the formula again here: n(P1/P2) = (ΔHvap/R)((1/T2) - (1/T1)). I'm really doing a rote memorization of it now for the now because I haven't got the attention to try and understand it or why the constant R would appear in it, but at least I remember what R meant. According to my grade 11 chemistry textbook that I was lent by the school when I was in grade 11 chemistry, R is defined such that PV = nRT. Apparently, R is the same for all gases. It gives temperature on a linear scale and pressure on a logarithmic scale. You would have to go down to minus infinity on the $y$ axis to get zero pressure. I guess 0.1 Pa is negligibly low on a linear scale so they didn't feel the need to show it below 0.1 Pa.

Timothy
  • 1,708