So, I'm trying to simulate the Ising Model on a 2D square lattice of spins. When exploring the auto correlation of the magnetisation: Where the auto covariance: $$A(T) = \langle(M(t)\ - \langle M\rangle)(M(t + T_L)\ - \langle M\rangle)\rangle$$ with $T_L$ being the lag time. The auto correlation is then $A(T)/A(0)$.
$\langle\cdot\rangle$ represents averaging over a long time. The decorrelation time $\tau_e$ is then defined to be the lag time required for the auto correlation to fall below $e^{-1}$.
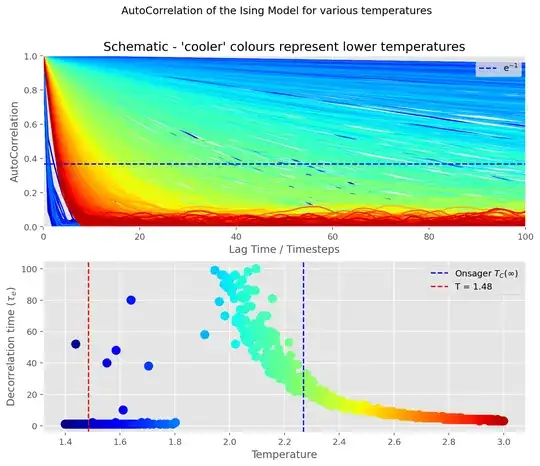
Plotting this out I get, in simulation units, for a $5\times5$ lattice:
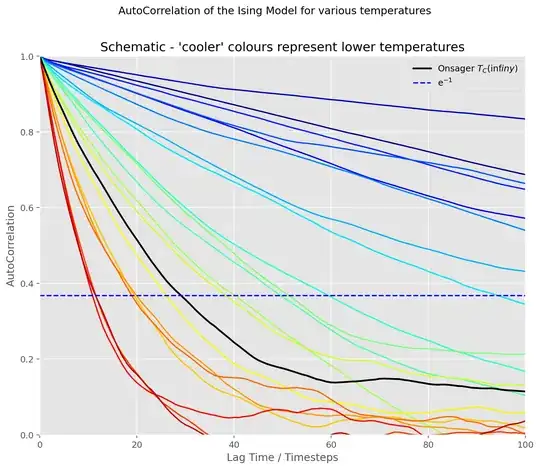
and, for far few temperatures around $T_C$:
I have some ideas of the features of this plot.
Firstly, closer to, but below Onsager's analytic value for the critical temperature, $T_C$ (around 2.0 - 2.2), there's long range magnetic order in the system, the lines are roughly straight. This makes sense, for a roughly constant magnetisation, with small thermal fluctuations, you'd expect a straight line $a(t) = 1$. The reason the line slopes is because the time averaging was done over a finite time, and because there's still some thermal activity in the system. So, as temperature increases the gradient of these lines become more negative. (Is there a way of "pulling apart" the value of the slope into these contributions?)
Beyond the critical temperature the system is disordered, so the auto correlation is no longer a straight line. (Looks exponential-ish?). The higher the temperature, the faster the decline.
Something that confuses me a bit is that region of colder temperatures that seem to just drop to $0$ auto correlation almost instantly, below about T = 1.8. My reasoning is that there are so few thermal fluctuations that $M - <M>$ is very often $0$. I believe this is just a product of a finite length simulation. Is there anything physical going on here? The line at T = 1.48 is just the first time my program plotted a line that didn't go below $e^{-1}$ in the range of $T_L$ in an attempt to "catch" this transition; I don't think it's ended up being a physically meaningful thing. There seems to be a fair bit of randomness as to whether a low temperature line behaves like this.
Am I thinking on the right lines here or am I totally interpreting this wrong? Or is my simulation just busted?
Thanks for any assistance. :)
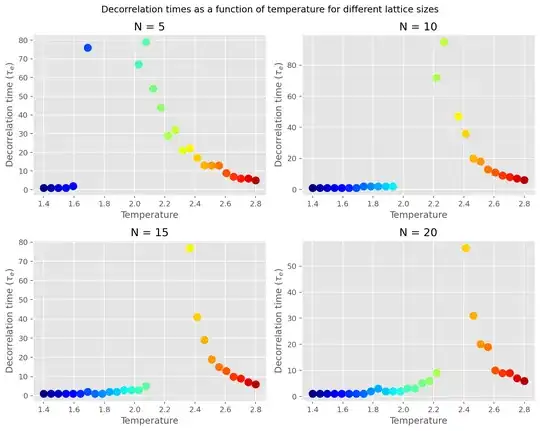
EDIT: After some more digging, the temperature range of the low $\tau_e$ zone below $T_C$ seems to depend on the size of the lattice. I'm quite stumped:
EDIT 2: After reading this question I think I have a better understanding: The correlation I'm measuring is actually the correlation between fluctuations rather than the magnetisation itself. In that case, it makes sense as to why this would decay exponentially both above and below $T_C$. I've encountered the idea of "Critical Slowing Down" around $T_C$ which may explain the large $\tau_e$ values there. If this is the right way to be thinking about this, I still have two questions:
Why does critical slowing down occur near $T_C$ - I've heard that the correlation length (and presumably the correlation time) diverges there, but have yet to find anything to explain why. If I am indeed measuring the correlation between fluctuations, why would this persist especially long near $T_C$?
Why does the point at which $\tau_e$ suddenly diverge seem to decrease in temperature with decreasing lattice size, despite the fact that $T_C$ increases for smaller finite lattices?
My current understanding
EDIT 3:
For an infinite lattice:
$0 < T < T_C$: All spins are under a strong pressure to align with neighbours, thus any fluctuation is quickly neutralized without much chance to affect the future evolution of the system.
$T >> T_C$: The system is fluctuation dominated: There is lack of alignment between local spins, so any given configuration of the system at one point in time is less likely to have influence on its configuration at another point in time. I.e. the system is dominated by a stochastic process and hence less deterministic.
$T = T_C$: The above two effects exactly balance: The correlation length of the system diverges, clusters of all sizes form with equal probability. Any fluctuation in the system will then influence infinity many other spins and necessarily have some effect on all future states. Hence $\tau_e$ also diverges.
What we see in the above figures is a similar effect: However, as the finite lattice size becomes smaller lower temperature fluctuations have a greater chance of affecting the future evolution of the system, because a single spin constitutes a greater proportion of all spins in the system. $\tau_e$ also never truly diverges, due to the finite nature of the lattice. As the lattice size increases, the position of these "spikes" in $\tau_e$ will move asymptotically closer to $T_C$ for an infinite lattice. Computationally, this means that the time to bring a system to equilibrium, as well as the time needed to elapse to get an averaged value of a given accuracy, increases dramatically around these "spikes".


