(I discuss the case of the Ising model, for concreteness, but most of what I say below holds much more generally.)
The correlation length below $T_c$ is defined through the truncated 2-point function, namely
$$
\langle \sigma_0\sigma_x\rangle^+ - \langle \sigma_0\rangle^+ \langle\sigma_x\rangle^+ \sim \frac{1}{|x|^{d-2+\eta}}e^{-|x|/\xi},
$$
where $\langle\cdot\rangle^+$ denotes the expectation w.r.t. the $+$ state (one must precise the state below $T_c$ as there are several). I am cheating a bit (as you do), by doing as if $\xi$ was isotropic (it's not for lattice models, except asymptotically close to $T_c$).
Also, in the definition of $\xi$, one has to let $|x|$ go to infinity above. More precisely, one would define
$$
\frac{1}{\xi} = - \lim_{|x|\to\infty} \frac1{|x|} \log \bigl(\langle \sigma_0\sigma_x\rangle^+ - \langle \sigma_0\rangle^+ \langle\sigma_x\rangle^+ \bigr).
$$
In particular, for $T>T_c$, you really have
$$
\langle \sigma_0\sigma_x\rangle \sim \frac{1}{|x|^{(d-1)/2}}e^{-|x|/\xi},
$$
for all $|x|$ large compared to $\xi$. This exponent $(d-1)/2$ is typical of what is known as the Ornstein-Zernike behavior.
Similarly, when $|x|\gg\xi$, one has, for $T<T_c$,
$$
\langle \sigma_0\sigma_x\rangle^+ - \langle \sigma_0\rangle^+ \langle\sigma_x\rangle^+ \sim \frac{1}{|x|^{(d-1)/2}}e^{-|x|/\xi},
$$
when $d\geq 3$, while
$$
\langle \sigma_0\sigma_x\rangle^+ - \langle \sigma_0\rangle^+ \langle\sigma_x\rangle^+ \sim \frac{1}{|x|^{2}}e^{-|x|/\xi},
$$
when $d=2$ (this anomalous behavior when $d=2$ is the only claim that it really specific to the nearest-neighbor Ising model, and some relatives; for generic models, the behavior is also of Ornstein-Zernike type when $d=2$, that is, the exponent is $1/2$, not $2$).
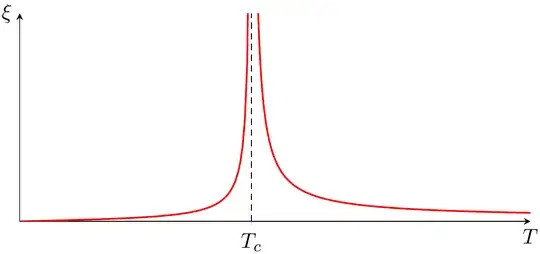
As to the interpretation of the correlation length below $T_c$ and its behavior as $T\downarrow 0$, I already answered that elsewhere: see this answer (and also this one). Here, I'll only provide a graph of $\xi$ (along the horizontal direction) as a function of the temperature for the two-dimensional Ising model, where it can be computed explicitly (note that $\xi$ tends to $0$ both as $T\downarrow 0$ and as $T\uparrow\infty$, although the latter isn't visible in the picture below).