1

In Griffith's Intro to Elementary Particles book, he wrote

there are infinitely many Feynman diagrams for any particular reaction!

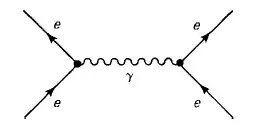
Why is this true? Take for example Moller scattering that describes Coulomb repulsion between 2 electrons. The only Feynman diagram I know of is:

enter image description here

What will be the other infinite Feynman diagrams for this reaction?

TaeNyFan
  • 4,376

2 Answers2

9

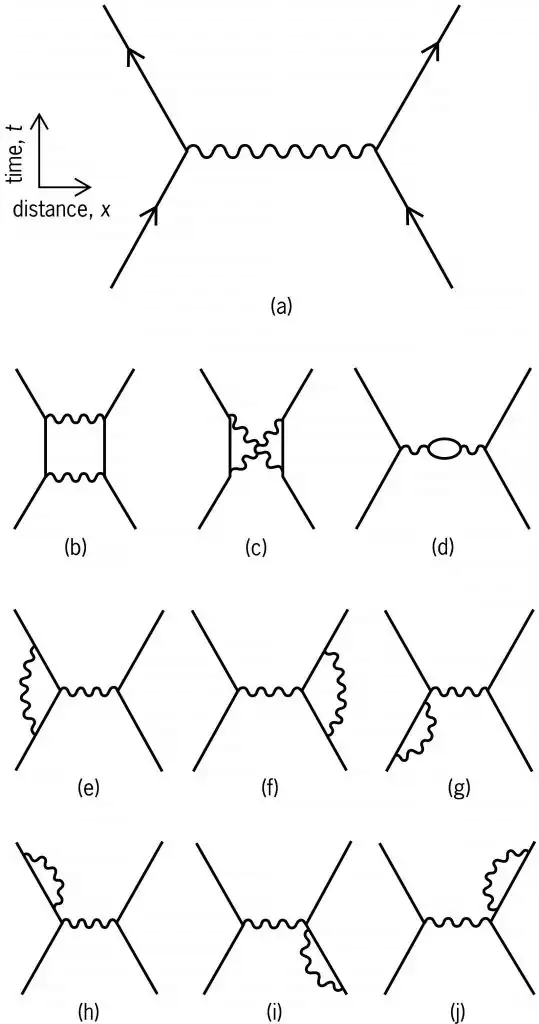
The cross section for a scattering process like Møller scattering is calculated by summing up an infinite series. Each term in this series is an integral that can be represented by a Feynman diagram. The diagram you have drawn is just the first term in the infinite series - the tree level term.

There is a nice illustration of the first few terms for Møller scattering in the Free Dictionary article on Feynman rules:

Møller scattering

After the tree level term (a) we have the one loop terms (b) to (j), then two loops then three loops and so on. The number of terms at each loop level escalates rapidly.

It is worth noting that the diagrams do not show an actual physical process. They must not be taken literally. They are just a pictorial representation of an integral called the propagator.

John Rennie
  • 367,598
2

I read from the article quoted by @JohnRennie:

The illustration shows Feynman diagrams for electron-electron scattering. In each diagram, the straight lines represent space-time trajectories of noninteracting electrons, and the wavy lines represent photons, particles that transmit the electromagnetic interaction. External lines at the bottom of each diagram represent incoming particles (before the interactions), and lines at the top, outgoing particles (after the interactions). Interactions between photons and electrons occur at the vertices where photon lines meet electron lines.

Well, this is wrong. Although it's also possible to interpret Feynman diagrams as representing space-time diagrams [1] their form now in universal use is as a momentum space diagram, and a topological one. The only things a diagram is meant to show are relationships between interaction vertices and exchanged momenta.

It would be humorous to interpret the reported diagrams as space-time ones: you would have photons going from here to there following curved paths etc.

[1] Feynman diagrams
Elio Fabri
  • 5,968
  • 1
  • 11
  • 18