11

Looking at various two-variable phase diagrams I was struck by that on every one I have seen so far all the phases formed simple connected regions; see, for example the phase diagrams of $H_2O$ or of $Fe-Fe_3C$ in 1. Every phase is a connected region, no two disjoint pieces correspond to the same phase. Is this really true in general and if so why?

Going further, let us consider a three-variable phase diagram, say $p, T, y$, where $y$ maybe electric or magnetic field intensity, or some other controllable extensive/intensive variable. Is it possible that now a 3d region occupied by some phase is a kind of tube that makes a half turn so that if we fix, say, $y$ then the resulting 2d section would have two disjoint $p,T$ regions of the same phase? Can such phase "tube" exist or by some thermodynamic-geometric rule is it excluded?

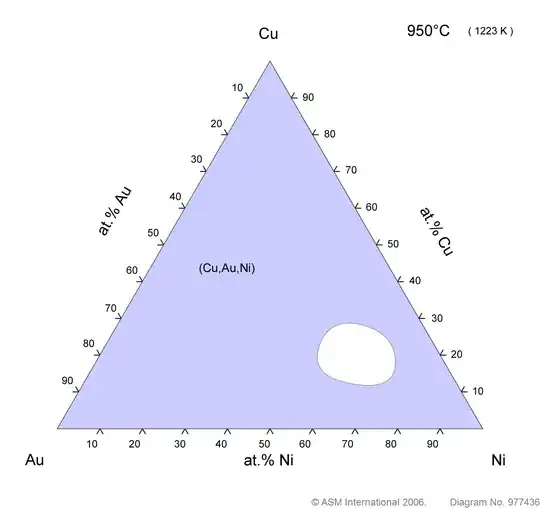
A possibly more difficult question if a phase can form an annular region, ie., homeomorphic to an annulus while surrounding another phase homeomorphic to a disk?

In short, what is the topology of the phase diagram and its sections?

Qmechanic
  • 220,844
hyportnex
  • 21,193

3 Answers3

1

I don't have a complete answer, but I do have some thoughts. I'm going to focus on the $T$-$P$ phase diagram for a pure substance because that is what I know best.

  • $T$ and $P$ are special coordinates because, at phase equilibrium they are uniform between all phases. A diagram based on $T$ and $v$ or $P$ and $T$ will not have the same topology. I mention this because it suggests (to me) that any proof of the properties you observe will in some way make use of the fact the coordinates are $T$ and $P$

  • One (kind of disappointing) answer would be that this is just the way that we've defined phases: chop up the phase diagrams into regions with distinct boundaries and label each region as its own phase.

A more mathematical answer would be that, at any given $T$ and $P$, the equilibrium phase(s) are those with the lowest $g$ (specific Gibbs energy, also called chemical potential $\mu$). Imagine a plot of $g(T,P)$ with one series (surface) for each phase that could ever exist. For some phase X, the partial derivatives of $g_X(T,P)$ are

\begin{align} \left(\frac{\partial g_X}{\partial T}\right)_P = - s_X \hspace{5em} \left(\frac{\partial g_X}{\partial P}\right)_T = v_X \end{align}

  • Phase boundaries occur when two of these surfaces intersect. At each such intersection, the phases have the same $T$, $P$ and $g$ but different $s$ and $v$, and thus the rates of change of the intersecting surfaces along the $T$ and $P$ directions are different. The surfaces therefore cross.

  • Let's imagine that we are at some point $(T_0, P_0)$ at which increasing $T$ causes phase A to transform into phase B (the phase boundary between A and B at some given pressure $P$). At lower $T$, phase A has lower $g$, but at higher $T$, phase B has lower G, so it follows that

\begin{align} \left(\frac{\partial g_A}{\partial T}\right)_P &> \left(\frac{\partial g_B}{\partial T}\right)_P \\ -s_A &> -s_B \\ s_B &> s_A \end{align}

  • If phases A and B can coexist again at the a higher $T$ labelled $T_1$ and the same $$, then they must somehow reach the same $g$ again, i.e. it must be true that

\begin{align} \int_{T_0}^{T_1} \left(\frac{\partial g_A}{\partial T}\right)_P\ \text{d}T &= \int_{T_0}^{T_1} \left(\frac{\partial g_B}{\partial T}\right)_P\ \text{d}T \\ \int_{T_0}^{T_1} -s_A(T, P_0)\ \text{d}T &= \int_{T_0}^{T_1} -s_B(T, P_0)\ \text{d}T \end{align}

  • This implies that, for a second crossing, the phase which initially has higher $s$ must switch over to having lower $s$ for some period, such that the integrals cancel out and the two states again reach the same $g$. This strikes me as unusual, potentially impossible behaviour. A similar argument could be made by swapping $T$ for $P$ and $-s$ for $v$.

The big flaw with this mathematical approach is that it assumes that $g_X(T,P)$ is well-defined for every phase at every $T$ and $P$. In classical thermodynamics, this function is only well-defined in regions where X is an equilibrium phase.

user1476176
  • 1,511
1

In regards to your last point:

A possibly more difficult question if a phase can form an annular region, ie., homeomorphic to an annulus while surrounding another phase homeomorphic to a disk? Blockquote

I think such a topology is possible. I don't have a rigorous proof for this, but I have seen phase diagrams like this. As an example, the Au-Cu-Ni ternary diagram (isothermal at 950C) seems to show this. The blue region is a single phase (FCC) and I believe the white region is a two phase region between different 'composition sets' of the FCC. This diagram was found from experiments in 1990 (I found it on ASM phase diagrams)

enter image description here

sgp45
  • 111
-1

Based on intuition, I do not think it is possible for phases to be disconnected, and to understand this I think we need a better idea of what we mean when we call something a "phase." Typically, we think of a phase as the structure (or symmetry) of a material.

For example, in the $H_2O$ example, it is possible to travel from the liquid phase to the gas phase without undergoing a phase transition, by moving around the critical point. The only aspect distinguishing these two phases is the density of molecules. Alternatively, we can get an overlap region in the phase diagram if we consider materials that undergo a hysteresis. By controlling an external field, you can shift a material into a specific phase that it will maintain when you turn the field off. In this way you might think that two possible phases could overlap in the phase diagram depending on the history of the system (It would be more of a metastable state).

If you're only concerned about the structure, then usually a third axis to consider is composition of an alloy. An alloy can be FCC at 90% species A and 10% species B, have some arbitrary middle phase, and then FCC again at 10% species A and 90% species B. Typically, since the concentration of material is different, we label that differently.

For a pure material, we may control its macroscopic degrees of freedom (dof), such as temperature and pressure, but not the microscopic dof, such as molecule locations. By setting the macroscopic dof, the molecules respond by arranging in a preferred state that is a balance of many energetic contributions at the microscopic level. The relative strengths of these contributions are dependent on the macroscopic properties such as temperature, pressure and external fields that set a minimum energy state as well as microscopic contributions like paramagnetic effects. You can get interesting phases when these effects are comparable, for example spinodal decomposition.

This is how I think of it intuitively, in terms of microscopic energy balances and driving forces. Mathematically, I cannot show that an energetic contribution can dominate in two distinct locations of the phase diagram or that some balance of them leads to identical states. It isn't something I have come across and cannot imagine such a case where fixing some contributions doesn't lead to an uncontrolled contribution adjusting (for example in the case with density fluctuations in $H_2O$ with temperature and pressure or volume fixed).