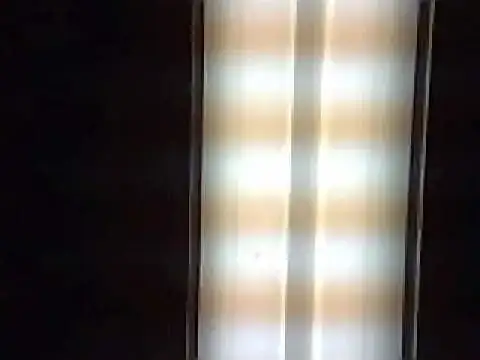
I'm quite surprised by these regularly spaced rings of alternating brightness in a fluorescent tube. These are also moving along the tube and only appear when the voltage is low. What are these and does the pattern have anything to do with AC frequency?
4 Answers
This reminds me of the Franck-Hertz experiment where similar patterns occur.
At low voltage, the free electrons in the tube will be accelerated by the voltage until they have enough energy to excite a gas atom by hitting it. The atom eventually falls back to the ground state and emits the light. Due to quantization of the excitation levels, this appears in spacing.
When the voltage is high enough, most of the gas is excited such that the electrons can move freely and therefore the pattern is gone.
- 8,559
It's been suggested that the pattern is due to a standing density waves (sound) in the plasma inside the tube, where the orange/blue spots might correspond to nodes/antinodes in the standing wave. You can attempt to find the frequency of some electrical signal that might be causing this by first measuring the distance between a pair of blueish (or a pair of pinkish) spots, and call that the wavelength $\lambda$. Then compute a rough theoretical estimate of the speed of sound in a mercury vapor plasma from:
$v = 9800\times \sqrt{ \dfrac{\gamma T_e}{\mu} }$ (meter/sec)
where $\gamma = 1$ for reasons I won't go into, $T_e$ is the electron temperature and $\mu=200.6$ which is the mass ratio of mercury (Hg) to a proton. We can estimate an electron temperature from the 1st ionization potential for mercury, which is about 10.4 volts. Free electrons will need to be accelerated to a kinetic energy (KE) of 10.4 eV in order to ionize mercury atoms. The KE of electrons in a plasma is related to their electron temperature by $\langle KE\rangle=kT_e$ where $k$ is Boltzmann's constant. So we get an electron temperature of roughly
$T_e = (10.4~eV)(1.602\times 10^{-19} J/eV)~~/~~(1.38\times 10^{-23} J/K) = 1.21\times 10^5 K$
This seems about 10 times higher than the actual thermal temperature of the plasma inside the tube, but there are reasons why this is so (Google "electron temperature")
So... $v = 9800 \sqrt{\dfrac{1.21 \times 10^5}{200.6}}$ = $2.41\times 10^5$ m/s. (Yeah, that's fast)
Now, using $f=v/\lambda$, you can calculate the frequency of some signal causing the pattern.
$\it{Example}$ : if $\lambda$ = 20 cm, then $f=$1.20 MHz, which is definitely a frequency associated with AM radio carrier waves.
Maybe this analysis is correct, and maybe there's some other mechanism making the pattern, but go ahead and measure $\lambda$ and turn the crank to see what you get for frequency $f$. Then try building an RF transmitter you can vary about the frequency value you calculated, and see if you can make the pattern change as you change the frequency of the transmitter near the bulb.
Good luck!
- 421
These rings are called "Faraday cones", according to Wikipedia. They occur when the mercury vapor pressure is low. I have most often seen them when a fluorescent bulb is colder than 70 degrees F, especially in bulbs nearing the end of their life. They may disappear and the brightness increase as the bulb warms up. Perhaps this can lead you to a mechanistic explanation.
- 21
The stripes are also known as striations. The yellow patches are only lit by the fluorescent powder energized by the UV from the discharge in the adjacent bright patches. When the electrons excite the gas atoms as mentioned by Martin Ueding, they lose their energy and have to be re accelerated to excite more gas atoms as in the Franck-Hertz experiment mentioned by Apollonius. It happens in gas discharge tubes with flat electrodes, (or in this case small electrodes) and low current. They avoid this effect in neon sign tubes by having long electrodes that smear the striations over each other.
- 453
