5

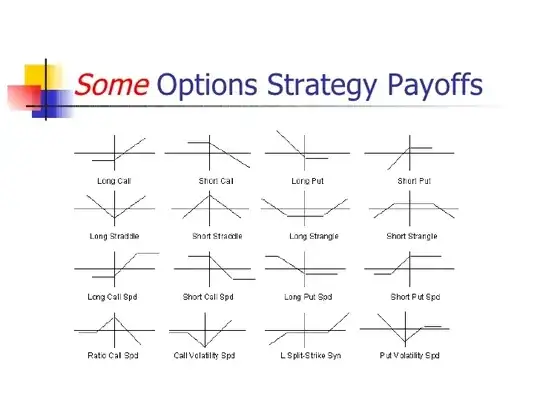
I'm learning options and I've seen strategies with graphs like these:

enter image description here

Why is not possible to combine a Butterfly with Straddle to get something like this (green is final result):

enter image description here

I'm very new in options so sorry if I'm asking something obvious, but I think this example will help to understand it better.

EDIT I have found a nice site to create these graphs:
https://optioncreator.com
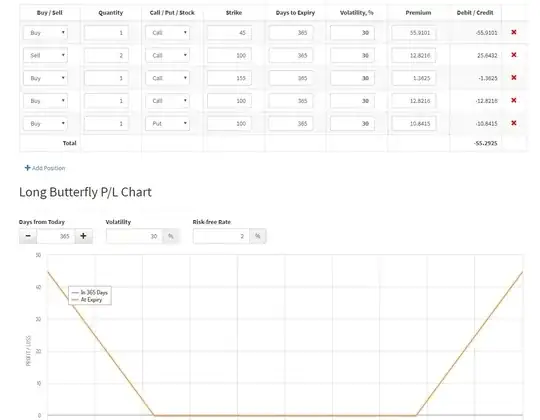
Playing with it I was able to create the graph from above, but it requires a big spread for the butterfly, is that a problem?

enter image description here

The graph is cut, but the middle price is "100" and strategy becomes profitable if it ends below 45 or higher than 155. That means we need like 60% of change, this is not usual but is not impossible, and since is a non risk trade we could just use it in multiple stocks and wait one of them moves that amount? What I'm missing here?

Enrique
  • 593
  • 1
  • 5
  • 15

4 Answers4

11

In terms of the risk graphs, your thought process is correct. If you combine a Short Butterfly with a Long Straddle, you end up with the risk graph of the green line. Unfortunately, because options cost money, there are no free lunches and that is the error in your assumption. Now I know that you're not going to accept that explanation on face value so let's try something more technical.

There are 6 basic synthetic positions relating to combinations of Puts, Calls and their underlying Stock. It's called the Synthetic Triangle:

  1. Synthetic Long Stock = Long Call + Short Put

  2. Synthetic Short Stock = Short Call + Long Put

  3. Synthetic Long Call = Long Stock + Long Put

  4. Synthetic Short Call = Short Stock + Short Put

  5. Synthetic Short Put = Long Stock + Short Call

  6. Synthetic Long Put = Short Stock + Long Call

There are additional synthetic combinations. For example, a Bullish Vertical Spread is equal to Long Collared Stock. A bullish debit Vertical Spread is equivalent to a bullish credit Vertical Spread when options of the same strikes and series are used. Once you understand the Synthetic Triangle, you can simplify complex positions into positions with fewer legs. That has two benefits. First, it's often easier to visualize the simplified position's P&L and second, you incur less frictional costs when you transact with fewer legs.

A Butterfly Spread is comprised of a bullish and bearish Vertical Spread with a common central strike. It can be constructed several ways and they all have a similar R/R. Using the Synthetic Triangle you can verify that the following three positions are equivalent:

1) Buy one $95p, sell two $100p, buy one $105p

2) Buy one $95c, sell two $100c, buy one $105c

3) Buy one $95 put, sell one $100p, sell one $100c, buy one $105c

Now, let's take # 3 and add a long straddle at the center strike and simplify the equation. We then have:

  • +1 $95p - 1 $100p -1 $100c + 1 $105c (Long Butterfly)

  • +1 $100p + 1 $100c (Long Straddle)


  • +1 $95p +1 $105c (Long Strangle)

The green line in your graph is the P&L of a Long Strangle. The problem is that you assumed that it would be free and you put the horizontal line at ZERO. Long Strangles aren't given out for free. They cost money. The base of your green line graph belongs in negative territory and that will always be the risk.
Bob Baerker
  • 77,328
  • 15
  • 101
  • 175
2

The question was asked as to how one can place a Butterfly Spread by "mixing puts and calls".

The relationship between put and call prices involves an arbitrage position called a Conversion. This process dates back to the over the counter days when a dealer who owned a put was able to satisfy a potential call buyer by "converting" the put to a call. The formula is:

Stock - Strike Price + Put - Call + Carry Cost + Dividend = 0

To make this easier to follow, let's assume that the Strike Price is equal to the Stock Price, that there is no dividend and let's pretend that there is no Carry Cost. That leaves us with:

Stock + Put - Call = 0

There are 6 factored combinations of this equation (see the previously posted Synthetic Triangle info). For example, the following demonstrates that a Covered Call is synthetically equivalent to a Short Put.

Stock - Call = - Put

Now back to Butterflies. The first one listed in my previous answer was:

(A) Buy one $95p, sell two $100p, buy one $105p

This is a pair of Vertical Spreads:

(B) = + 95p - 100p and (C) = - 100p + 105p

Let's take Vertical Spread (C) and do some Synthetic Triangle magic with it.

If S + P = C then S + 100p = + 100c and if factored with the signs changed it becomes:

(D) - 100p = S - 100c

Similarly, S + 105p = + 105c becomes:

(E) +105p = + 105c - S

Let's substitute (D) and (E) into (C)

(C) - 100p + 105p =

<p>S - 100c + 105c - S =</p>

<p>(F) - 100c + 105c</p>

which demonstrates that

(C) - 100p + 105p = (F) - 100c + 105c

Therefore, the vertical spreads (C) and (F) are equivalent. Substitute (F) for (C) in (A) and the result is:

(G) + 95p - 100p - 100c + 105c

which is buy one $95p, sell one $100p, sell one $100c and buy one $105c

and this Butterfly is equivalent to:

(A) Buy one $95p, sell two $100p, buy one $105p

QED

Bob Baerker
  • 77,328
  • 15
  • 101
  • 175
1

OK this is my conclusion:

  • The strategy is almost possible

  • We don't need to combine Butterfly + Straddle, is just a Strangle

  • The cost could be really low if we have a big spread in our strangle, but never 0

  • With a big spread our chances to win are very low
  • Because the chances to win are low, even when the cost is low too, is not 0, so we will end up losing money in most of the cases.
Enrique
  • 593
  • 1
  • 5
  • 15
0

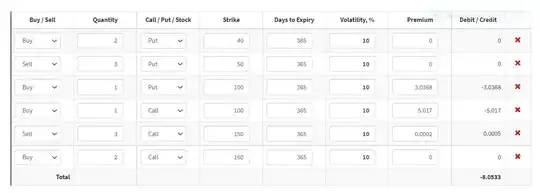
This is the closest i could get to a zero risk strategy. This strategy makes money when the price goes up or down. This consists of a put butterfly and a call butterfly.

Is it possible to make this strategy to have a positive theta value?

enter image description here EDIT: enter image description here enter image description here

Martin
  • 173
  • 2
  • 7