How to compare the growth of different stocks, mutual funds, and ETFs against each other all at once
Thanks, Bob Baerker for getting me on the right track! I'd like to post my own answer.
(This works for stocks or mutual funds--doesn't really matter).
- Go to www.marketwatch.com
- In the top right, click "SEARCH"
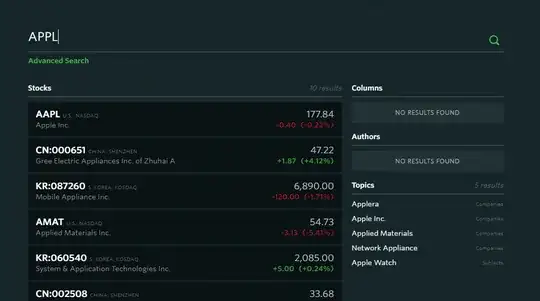
- Enter a symbol/ticker. Ex: "APPL" (Apple), then click the top result, as shown below:
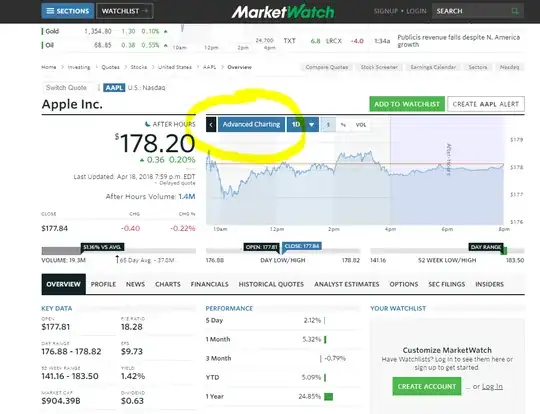
- Once it opens, click the "Advanced Charting" button near the middle of the screen.
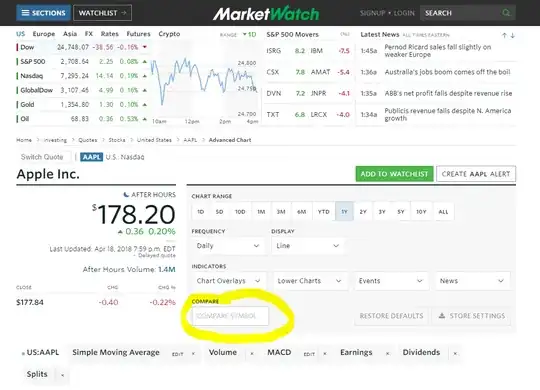
- Now, near the middle of the screen, click the box that says "COMPARE SYMBOL" and enter another symbol, ex: "AMZN" (Amazon), then press Enter.
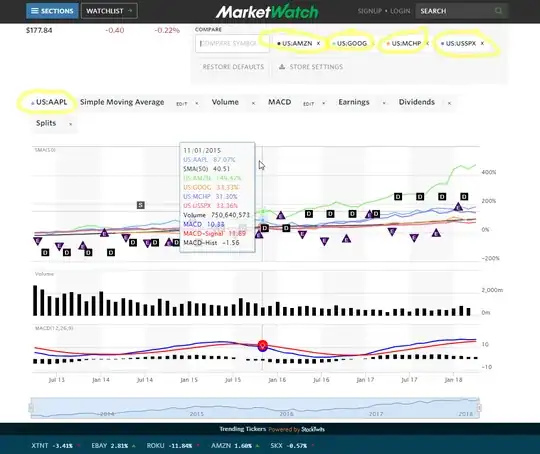
- Repeat adding more symbols as desired. Ex: "GOOG" (Google), "MCHP" (Microchip), "USSPX" (USAA S&P 500 Index mutual fund).
- When done adding all of the symbols (stocks, mutual funds) you want, click any other options you want, ex: "5Y" to look at the last 5 years.
- Now you can hover your mouse over the chart to see the exact values at any given moment. Here's a screenshot showing the above 4 stocks and 1 mutual fund plotted all at once for the last 5 years, including a mouse-over view of the exact values on 11/01/2015.
This is a really great tool and nicely replaces the old Google Finance tool that was very similar but not quite as detailed.
It also contains more advanced plotting features at the bottom such as the MACD (Moving Average Convergence Divergence), which is essentially just a low-pass filter of the data so you can see the more local trends.
Though I don't yet understand all the intricacies of this chart it certainly does have a lot of features and looks super useful!
If you'd like a jump-start on your charting adventures, use this link here to jump straight to the "AAPL" chart page where you can begin adding your own stock and mutual fund symbols to compare: https://www.marketwatch.com/investing/stock/aapl/charts.
 (Source --> then click the "5 years" comparison button. Note that if you type a new ticker into the "Compare custom stock or index" box it will replace one of the current comparisons [which is what I DON'T want] rather than add the new ticker to the current comparison [which is what I DO want])


