4

I've invested in a number of mutual funds, and I've calculated the annualised return of each of them, using a spreadsheet (and the xirr function).

I want to calculate the annualised return of the entire portfolio, starting from the time I started investing (at which point my portfolio was zero rupees) till today. I'm looking for a single number like: 12%. Presumably I have to take a weighted mean, but that's the weight?

Keep in mind that the investment style is irregular and doesn't fit textbook assumptions:

  • The amounts are irregular: There were some months where I invested 40x as in other months.
  • The frequencies are also irregular. For a while, I invested every month, and then went a few months without investing a single rupee.
  • The split across funds is also irregular. I've chosen a fund, pumped in all my money into it for a year or so, then chosen another one, and repeated the process. So the percentage of a particular fund in my overall corpus varies significantly over time.
  • After I stopped investing in a fund, I may have withdrawn some, all or none of the money. And if it's some, either a small fraction, or a large one. And over one transaction or many.
  • I'm hesitant to accept an approximation given the irregular style of investment I mentioned above. An approximation may be significantly off. So I don't want to accept it unless I know by how much it's off. In other words, I'll accept 8±1%, but not 8%.

I have the statements of the funds with me. Each row has a date, an amount invested or redeemed, the NAV as on that date, the number of units bought or redeemed, the unit balance and the rupee balance. Note that for each date, only one fund it listed: if on Jan 2, I invest in fund A, only fund A is listed for Jan 2. If the next investment is in fund B on March 5, then only fund B is listed for March 5.

In addition to this, I can also find out the NAV for any fund as on any required date.
Kartick Vaddadi
  • 672
  • 1
  • 4
  • 15

2 Answers2

5

The way I do it is to take each individual return and form a weighted mean of them, the weighting being the value of the individual investment.

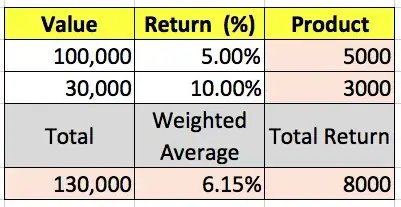
For example, suppose you have two investments of values $100,000 and $30,000. The larger one returns 5% and the smaller one returns 10%.

Find the value of the return of each (e.g. 100,000 X 5/100), sum the returns ($8,000) and divide by the total investment ($130,000).

The figure 6.15% below the "Weighted Average" label is the weighted average (8000/130000).

enter image description here


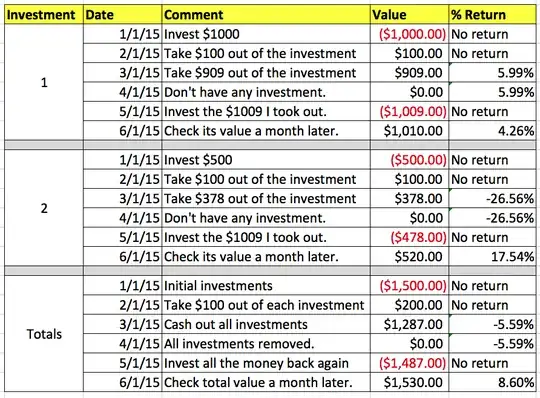
Thank-you for the clarification, I think I see your issue now. Below is an attempt to explain what I do.

enter image description here

The rows beside the merged rows 1 and 2 show what I do with each individual investment. The idea for the 6/1/2015 row is that I haven't actually liquidated the investments, I'm just checking on their progress.

For the total return, I just (effectively) do as I explained above: I total the returns / investments in my portfolio and apply the same XIRR formula to them.

Note, for example, in April I had no investments. The returns (losses) I made are the same as when I liquidated my assets in March.

I tend to be a simpler than this example here: I am a buy and hold investor, so I don't tend to liquidate much except for rebalancing very occasionally.

Peter K.
  • 3,983
  • 2
  • 27
  • 36
2

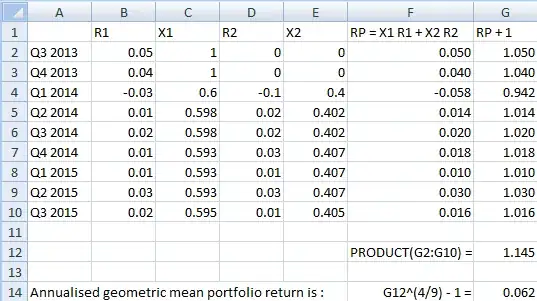
Here's an example using quarterly returns to illustrate annualisation.

The portfolio has two assets with returns R1 and R2. X1 and X2 are the fractions of the portfolio's value held in each asset. RP is the quarterly portfolio return. The annualised average return is calculated by geometric averaging because the returns are compounded. In ...^(4/9) the 4 annualises the quarterly returns and the 9 is for geometric averaging over 9 periods.

enter image description here

The portfolio return is 6.2% per annum.

Chris Degnen
  • 10,107
  • 1
  • 21
  • 36