my understanding of candlestick charts is that they are composed of open/high/low/close values of a particular timeframe. Now, if I opt for a, say, hourly chart, this would imply that the opening value of any candle should exaclty match the closing of the previous one, shouldn't it?
However, I frequently observe the oposite in that there are "overlaps" of candles, ie. the closing value of one timeframe is lower that the opening value of the next, or vice versa.
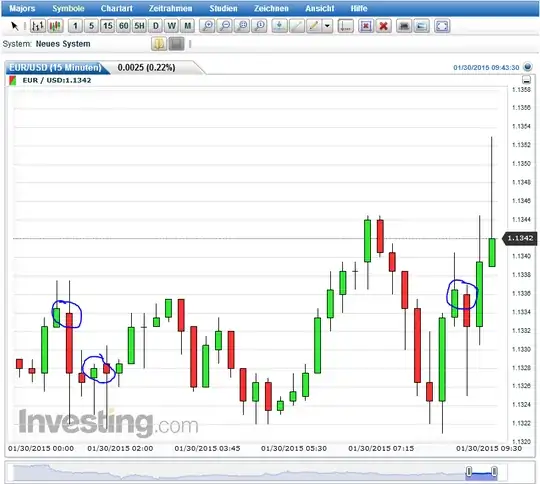 How can this be, as the trading is continous. I could understand this on a dayly chart with no trading during the night - but on an hourly or 15-min chart?
What am I missing?
How can this be, as the trading is continous. I could understand this on a dayly chart with no trading during the night - but on an hourly or 15-min chart?
What am I missing?
Asked
Active
Viewed 4,194 times
8
Bob Baerker
- 77,328
- 15
- 101
- 175
dlrts
- 91
- 1
- 3
2 Answers
5
Remember that prices refer to discrete events in the market - trades - it is easily possible that the highest price for a trade in the next period is lower than the highest price in the current one as someone in the current period may be willing to pay more in this period than anyone in the next. The ending price of a period is also determined this way; it is the last price that someone was willing to pay in this period not the first price that someone will pay in the next period. Why? because the last price in this period is not in the next period by definition!
edit: added something on illiquid stocks
Illiquid stocks may have intraday gaps in the sequence of candlesticks where no trading occurred. Below is one such chart for 1pm plc.(OPM.L) a UK based leasing company (thanks to Yahoo finance for this):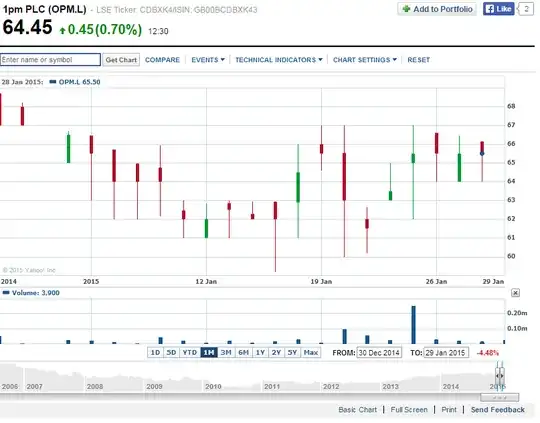
MD-Tech
- 9,156
- 2
- 34
- 42
0
The market is simply gapping at these times, some news may have come out that makes the market gap on the open from its previous close.
Being FX, the market in one country might be trading and then at the start of the hour trading in a different country may commence, causing a small gap in price.
Generally many things could cause the price to gap up or down, and these gaps sometime can occur at the start of a new hour or other timeframe you are using. They do tend to happen more often at the start of a new day's trading on a daily chart, especially with stocks.
Victor
- 20,987
- 6
- 48
- 85