Welcome new user, it's
Just bad data.
This actually gets asked a lot on here.
It's just bad data. There's nothing more to it than that.
However,
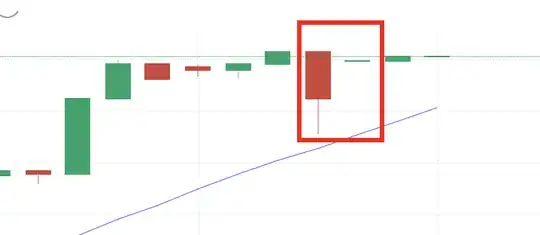
Do note that if this is a thin market,
It is perfectly possible that is a gap.
Don't forget one of the actual ideas of candlesticks is to easily observe gaps. Imagine more typical candles, which show one entire session of trading. (ie one day == one candle.) It's perfectly normal the open on Thursday is quite different from the close on Wednesday.
If your chart is of a thin market (imagine say "one trade per minute") it's completely normal to see what you see.
If you want to "trade candlesticks" I truly urge you to read the actual original book on the matter, the first translation of the original Japanese.
(I no longer give out the name of the book/author since if anyone is that unmotivated, better pedagogy to fail fast :/ )
Good luck!