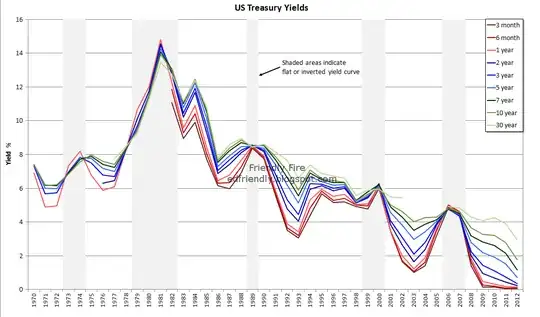
This directly relates to the ideas behind the yield curve. For a detailed explanation of the yield curve, see the linked answer that Joe and I wrote; in short, the yield curve is a plot of the yield on Treasury securities against their maturities. If short-term Treasuries are paying higher yields than long-term debt, the yield curve has a negative slope. There are a lot of factors that could cause the yield curve to become negatively sloped, or at least less steep, but in this case, oil prices and the effective federal funds rate may have played a significant role. I'll quote from the section of the linked answer that describes the effect of oil prices first:
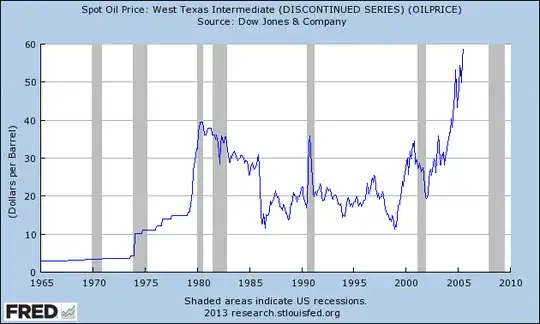
a rise in oil prices may increase expectations of short-term inflation, so investors demand higher interest rates on short-term debt. Because long-term inflation expectations are governed more by fundamental macroeconomic factors than short-term swings in commodity prices, long-term expectations may not rise nearly as much as short term expectations, which leads to a yield curve that is becoming less steep or even negatively sloped.
As the graph shows, oil prices increased dramatically, so this increase may have increased expectations of short-term inflation expectations substantially.
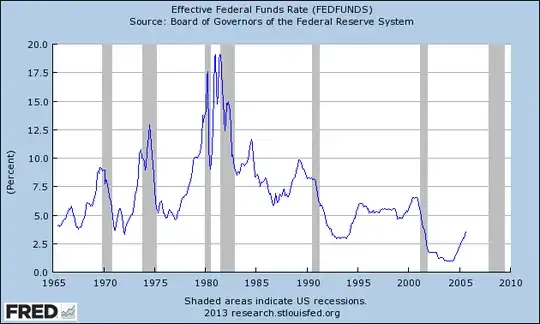
The other answer describes an easing of monetary policy, e.g. a decrease in the effective federal funds rate (FFR), as a factor that could increase the slope of the yield curve. However, a tightening of monetary policy, e.g. an increase in the FFR, could decrease the slope of the yield curve because a higher FFR leads investors to demand a higher rate of return on shorter-term securities. Longer-term Treasuries aren't as affected by short-term monetary policy, so when short-term yields increase more than long-term yields, the yield curve becomes less steep and/or negatively sloped.
The second graph shows the effective federal funds rate for the period in question, and once again, the increase is significant.
Finally, look at a graph of inflation for the relevant period.
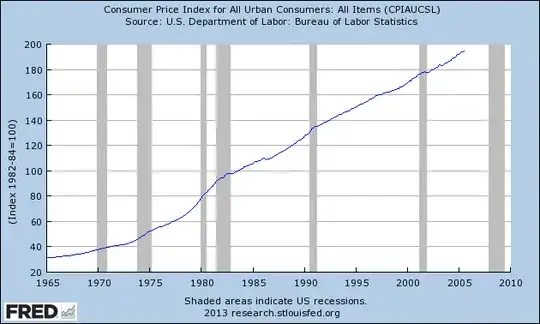
Intuitively, the steady increase in inflation from 1975 onward may have increased investors expectations of short-term inflation, therefore increasing short-term yields more than long-term yields (as described above and in the other answer).
These reasons aren't set in stone, and just looking at graphs isn't a substitute for an actual analysis of the data, but logically, it seems plausible that the positive shock to oil prices, increases in the effective federal funds rate, and increases in inflation and expectations of inflation contributed at least partially to the inversion of the yield curve. Keep in mind that these factors are all interconnected as well, so the situation is certainly more complex.
If you approve of this answer, be sure to vote up the other answer about the yield curve too.