1

I am reading the book, "A Random Walk Down Wall Street: The Time-Tested Strategy for Successful Investing (Twelfth Edition)", to better understand investing.

Chapter 14., section 2. has the following image, which depicts the range of return of stocks reducing as the time period increases.

I believe this implies that over a larger time period the risk attributed to stocks greatly reduces. In addition, it is well known that market returns are directly proportional to the risk of a particular security. Does that mean holding a particular security for a longer period of time would reduce one's risk while providing the return attributed to high risk?

Edit 1: To put this question into my perspective, would it be prudent for a young investor (early 30s) to have almost negligible bonds (<2%) if they plan to invest for a longer time period, i.e ~40 years?

enter image description here

desert_ranger
  • 373
  • 3
  • 7

3 Answers3

3

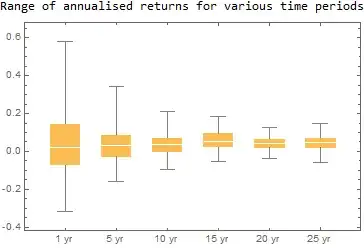
Here is a simple model which produces a similar chart. Each box-and-whisker simulates 100 investments returning anything between 9% and -8% per month, compounded and annualised. The upper & lower fences show the maximum and minimum investments' return.

Generally the chart shows the volatility of return reducing for longer investments.

enter image description here

OP: "Does that mean holding a particular security for a longer period of time would reduce one's risk while providing the return attributed to high risk?"

Risk is quoted for a specific time period for comparison purposes, but yes, risk (or volatility) does settle down for longer investment periods. The mean return is basically the same for all the time periods in this example, but if the volatility is higher there is a higher chance of a return further away from the mean, either higher or lower.

The chart above was produced with the Mathematica code below.

{hi,lo}={9,-8};
Labeled[BoxWhiskerChart[{
Table[(Fold[Times,100,RandomReal[{hi,lo},12]/100+1]/100)^(1/1)-1,100],
Table[(Fold[Times,100,RandomReal[{hi,lo},60]/100+1]/100)^(1/5)-1,100],
Table[(Fold[Times,100,RandomReal[{hi,lo},120]/100+1]/100)^(1/10)-1,100],
Table[(Fold[Times,100,RandomReal[{hi,lo},180]/100+1]/100)^(1/15)-1,100],
Table[(Fold[Times,100,RandomReal[{hi,lo},240]/100+1]/100)^(1/20)-1,100],
Table[(Fold[Times,100,RandomReal[{hi,lo},300]/100+1]/100)^(1/25)-1,100]},
ChartLabels->{"1 yr","5 yr","10 yr","15 yr","20 yr","25 yr"}],
"Range of annualised returns for various time periods",Top]

To explain, RandomReal produces random numbers (60 of them in the 5 year case)

RandomReal[{hi, lo}, 60]/100 + 1 = {1.06035, 1.03478, ... , 0.991715}

Fold compounds the values starting from 100

Fold[Times, 100, {1.06035, 1.03478, ... , 0.991715}] = 163.174

This result is annualised

(163.174/100)^(1/5) - 1 = 0.102885 = 10.2885% return p.a.

Table[...,100] repeats the 5 year investment simulation 100 times.

From the 100 5 year returns obtained, the highest and lowest returns are plotted as the upper & lower fences of the "5 yr" box-and-whisker symbol.

Chris Degnen
  • 10,107
  • 1
  • 21
  • 36
2

When people say that over the long term investing in a broad index fund will return between 7 and 10% a year (depending on how they count dividends), that is what your chart shows.

If you look at the data used to produce that type of chart, you will see that for any random 12 month period, some will be great periods, others average periods and even some terrible periods. When you look at 36 month periods you are likely to see two goods and bad, or one good and two bad years, but sometimes you will get 3 years the same. The longer the period the more likely the total for that period will approach the mean.

To put this question into my perspective, would it be prudent for a young investor (early 30s) to have almost negligible bonds (<2%) if they plan to invest for a longer time period, i.e ~40 years?

I won't comment on the exact percentage. But that is the general advice.

You will see it in the portfolios in the time based retirement funds that many 401(k) plans have. The 25 year old employees will be picking a plan that doesn't expect them to retire for 40 years so it will be stocks heavy. Over the years the plan will become more conservative.

The same is true for 529 age based plans. If the child is a newborn it is heavily invested in stocks, but as they get closer to college the mix of investments changes. Once they hit high school it is almost all bonds.

mhoran_psprep
  • 148,961
  • 16
  • 203
  • 418
1

Let's make sure we're comparing apples to apples here:

I believe this implies that over a larger time period the risk attributed to stocks greatly reduces.

It reduces compared to short-term risk. But this is true for all types of investments, just because of the mathematical definition of "risk" in this case, which is just the variance of returns. With a larger sample size (more time points), the variance of a random distribution will decrease.

In addition, it is well known that market returns are directly proportional to the risk of a particular security.

True in general, more risk, more potential reward (and also more potential loss).

Does that mean holding a particular security for a longer period of time would reduce one's risk while providing the return attributed to high risk?

Yes, but again it reduces the risk compared to short-term holdings. The same would be true for "less risky" investment like bonds. Over a longer time horizon, the risk of those investments decreases as well. Equities will still be riskier than bonds no matter what horizon you are looking at (so long as you use the same horizon for both).

Put another way, the risk for any given one-year horizon should be roughly the same, but as you average out the highs and lows of multiple one-year horizons, the extremes in any one year are cancelled out, so you tend to get closer to the mean, or less variance, e.g. a "tighter" bell curve.

would it be prudent for a young investor (early 30s) to have almost negligible bonds (<2%) if they plan to invest for a longer time period, i.e ~40 years?

Absolutely! If one can weather the higher year-to-year fluctuations, then over a longer horizon one can afford to take more risk. As you get closer to retirement, it's wise to look at your investments and see if you need to reduce your risk because you are more dependent on the value of those investments. A common tactic is to put some of your investments in low-risk instruments so that you are more certain to have a specific amount to withdraw in the near future. If you have to withdraw a specific amount and the market drops 20%, withdrawing that amount in a down market can be near impossible to recover from.

D Stanley
  • 145,656
  • 20
  • 333
  • 404