12

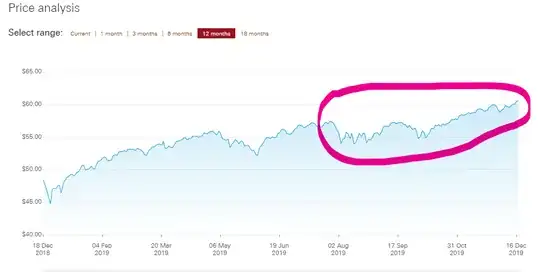
I have been recently reviewing my Vanguard S&P500 (VUSA) performance and I have noticed that it does not correlate with the performance of the same ETF on their website.

Inside Vangurad investment portal: enter image description here
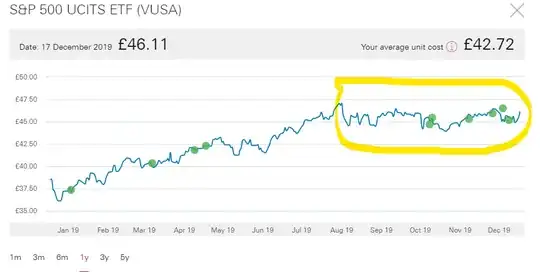
On Vanguard website: enter image description here

It got to the point that I'm confused why the graph for my VUSA performance doesn't look similar to the one from Vanguard's website?
MMT
  • 681
  • 1
  • 7
  • 12

2 Answers2

35

You're comparing an index that is measured in USD versus an ETF that tracks that index but is paid in GBP. The difference is mostly the difference in exchange rate over time between USD and GBP.

D Stanley
  • 145,656
  • 20
  • 333
  • 404
10

D Stanley is correct that the reason for the difference is the change in exchange rate. But your second chart is not of an index (nor are indexes measured in USD, rather in some "points").

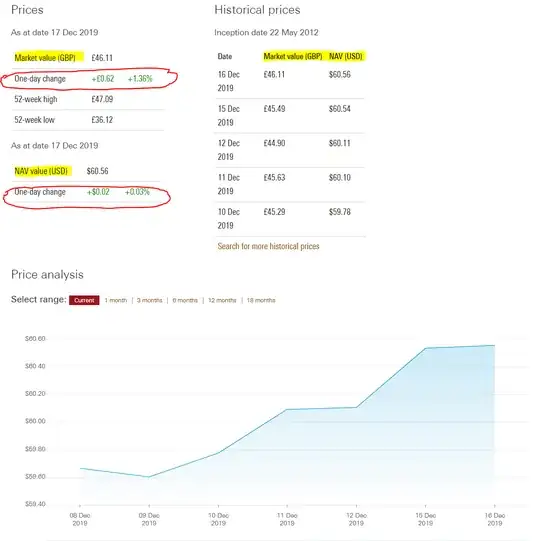
You are actually comparing the market price per share of your ETF in GBP (the ETF is traded on a UK exchange), to the net asset value per share in USD (the ETF holding are all traded on the US exchanges). The page you linked includes both in the tables above the chart:

enter image description here

Notice the substantial difference in "one-day change" between these metrics, which is wholly caused by the exchange rate.

Ben Voigt
  • 6,797
  • 2
  • 28
  • 30