I can't quite believe I'm having to ask this, but I can't work out how to get LibreOffice Calc to plot a basic graph.
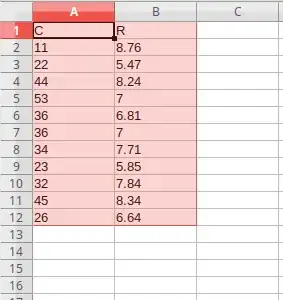
I have this data :-
C   R
11  8.76
22  5.47
44  8.24
53  7.00
36  6.81
36  7.00
34  7.71
23  5.85
32  7.84
45  8.34
26  6.64
I just want a straightforward graph of C against R. C on the X-axis, range 0-60. R on the Y-axis, range 0-10.
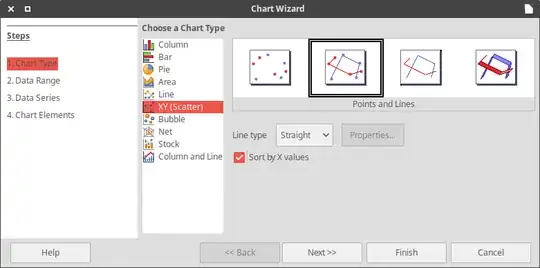
No matter what type of chart I choose from the Insert Chart wizard, I get 11 plots equally spaced along the X axis (there's 11 sets of data). R varies between 5.4 and 8.7 but the XY Scatter gives a much wider range than that. I'm not sure what is being plotted but it's not the values of R.
I've done multiple searches on here, and on Google in general, and have not found anything that helps. I think I want a graph, not a chart.
(Edited - some comments and an answer have been deleted so I've edited the relevant bits into the question to make it clearer)


