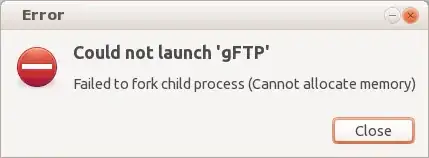
I'm using Ubuntu 12.10 with Gnome-Classic. I am getting this error frequently and with almost all programs, big and small. When I try to open them, they don't start, and instead I get an error message that says Could not launch 'Program' - Failed to fork child process (Cannot allocate memory). This wasn't a problem until within the last few weeks.
I can not discern any commonality among the programs that cause this error. It seems to be more a matter of time. After my computer has been running for a while, anywhere from a day to a few days, then I can't seem to start any new programs.
The only way I know to prevent this error is to reboot the computer.
Why am I getting this error and what do I do to stop it happening?
I ran the memtest available from the GRUB menu, and it reports no errors, so I don't think this is a hardware failure.
I also ran sudo apt-get check, and no errors were found.
Here is some requested command line output:
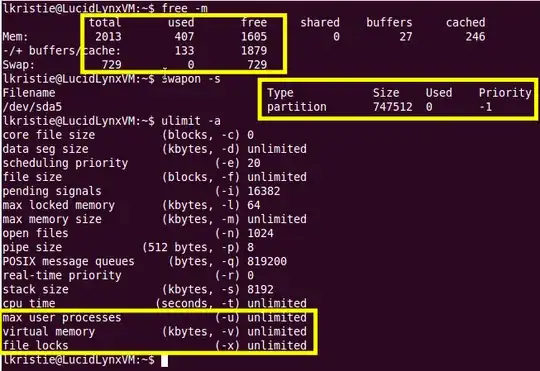
$ free -m
             total       used       free     shared    buffers     cached
Mem:          3945       3753        191          0        181        475
-/+ buffers/cache:       3096        848
Swap:         3813         60       3753

$ swapon -s
Filename                Type        Size    Used    Priority
/dev/sda6                               partition   3905532 61648   -1

$ ulimit -a
core file size          (blocks, -c) 0
data seg size           (kbytes, -d) unlimited
scheduling priority             (-e) 0
file size               (blocks, -f) unlimited
pending signals                 (-i) 31421
max locked memory       (kbytes, -l) 64
max memory size         (kbytes, -m) unlimited
open files                      (-n) 1024
pipe size            (512 bytes, -p) 8
POSIX message queues     (bytes, -q) 819200
real-time priority              (-r) 0
stack size              (kbytes, -s) 8192
cpu time               (seconds, -t) unlimited
max user processes              (-u) 31421
virtual memory          (kbytes, -v) unlimited
file locks                      (-x) unlimited
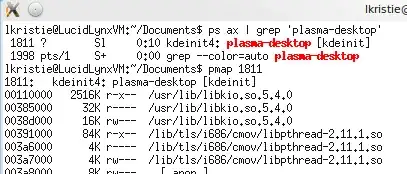
This is the output of ps --sort -rss -eo rss,pid,command | head after the error starts showing up:
$ ps --sort -rss -eo rss,pid,command | head
  RSS   PID COMMAND
1963400 2953 gnome-panel
155496 4029 banshee /usr/lib/banshee/Banshee.exe --redirect-log --play-enqueued
104944 15765 /opt/google/chrome/chrome --type=renderer --lang=en-US --force-fieldtrials=ForceCompositingMode/disable/GlobalSdch/global_enable_sdch/InfiniteCache/No/OmniboxDisallowInlineHQP/Standard/OmniboxHUPCreateShorterMatch/Standard/OmniboxHUPCullRedirects/Standard/OmniboxSearchSuggestTrialStarted2012Q4/2/OneClickSignIn/Standard/Prerender/PrerenderEnabled/SBInterstitial/V2/SpdyCwnd/cwndMin10/SpeculativePrefetching/Disabled/Test0PercentDefault/group_01/UMA-Dynamic-Binary-Uniformity-Trial/default/UMA-Session-Randomized-Uniformity-Trial-5-Percent/default/UMA-Uniformity-Trial-1-Percent/group_09/UMA-Uniformity-Trial-10-Percent/group_08/UMA-Uniformity-Trial-20-Percent/group_03/UMA-Uniformity-Trial-5-Percent/group_06/UMA-Uniformity-Trial-50-Percent/group_01/WarmSocketImpact/last_accessed_socket/ --enable-crash-reporter=ECE9000094D279FD3B14B35A74BF72CC,Ubuntu 12.10 --renderer-print-preview --disable-accelerated-2d-canvas --disable-accelerated-video-decode --channel=15654.5.89177240
78164 15654 /opt/google/chrome/chrome
74912 19890 /usr/bin/python /usr/share/oneconf/oneconf-service
65476 12419 /usr/bin/perl /usr/bin/shutter
61096 19626 /usr/bin/python3.2 /usr/sbin/aptd
57832 15708 /opt/google/chrome/chrome --type=renderer --lang=en-US --force-fieldtrials=ForceCompositingMode/disable/GlobalSdch/global_enable_sdch/InfiniteCache/No/OmniboxDisallowInlineHQP/Standard/OmniboxHUPCreateShorterMatch/Standard/OmniboxHUPCullRedirects/Standard/OmniboxSearchSuggestTrialStarted2012Q4/2/OneClickSignIn/Standard/Prerender/PrerenderEnabled/SBInterstitial/V2/SpdyCwnd/cwndMin10/SpeculativePrefetching/Disabled/Test0PercentDefault/group_01/UMA-Dynamic-Binary-Uniformity-Trial/default/UMA-Session-Randomized-Uniformity-Trial-5-Percent/default/UMA-Uniformity-Trial-1-Percent/group_09/UMA-Uniformity-Trial-10-Percent/group_08/UMA-Uniformity-Trial-20-Percent/group_03/UMA-Uniformity-Trial-5-Percent/group_06/UMA-Uniformity-Trial-50-Percent/group_01/WarmSocketImpact/last_accessed_socket/ --enable-crash-reporter=ECE9000094D279FD3B14B35A74BF72CC,Ubuntu 12.10 --extension-process --renderer-print-preview --disable-accelerated-2d-canvas --disable-accelerated-video-decode --channel=15654.2.1555888673
42108  3030 /var/lib/dropbox/.dropbox-dist/dropbox
Based on suggestions in the comments and answers, it seems possible the problem is with the Gnome Panel or its applets. Here are the applets I have running:

The applets are Indicator Applet 12.10.1, System Monitor 3.5.92, and a "notification Area". and "date and time", neither of which I can access the version number for.
Here is some more requested command line output:
$ df -h
Filesystem                             Size  Used Avail Use% Mounted on
/dev/sda5                               19G   12G  6.4G  64% /
udev                                   2.0G  4.0K  2.0G   1% /dev
tmpfs                                  790M  1.1M  789M   1% /run
none                                   5.0M     0  5.0M   0% /run/lock
none                                   2.0G   84K  2.0G   1% /run/shm
none                                   100M     0  100M   0% /run/user
/dev/sda7                              384G  306G   59G  84% /home
mythbuntu@192.168.0.4:/home/mythbuntu  437G  360G   55G  87% /home/dave/Mythbuntu
$ sudo du -csh /var/log
15M /var/log
15M total