I would like to plot a spectrogram of a sound between a range of frequencies, specifically from 0 kHz to 2000 Hz. Using SoX (sox sound.wav -n spectrogram -x 1000 -y 800), I have been able to make a plot, but I have not been able to set the vertical frequency axis to the range I require:
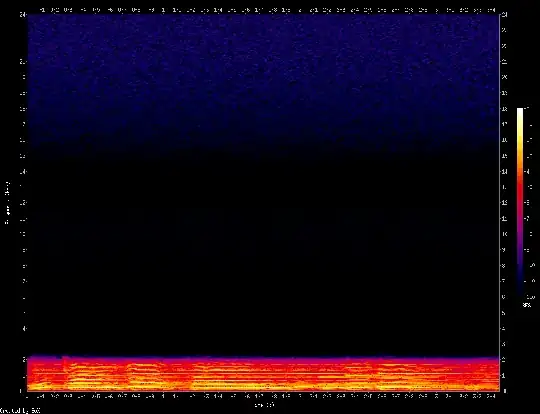
How might this be done? I am happy to use a different program.