18

I'm using Ubuntu and every couple minutes it goes unresponsive for a half second to a full second, which isn't normally a problem but makes trying to code extremely frustrating when your trying to hit backspace or navigate the code and nothing is happening. The problem is, the freezes are so brief that top doesn't have time to show me what is spiking the CPU (assuming something is, but I don't know what else could cause this).

Does anyone know how to troubleshoot this performance issue?

Edit: I've tried login in with Gnome Classic (No Effects) instead of Unity but it still freezes up every once in awhile.

Edit: The CPU graph doesn't seem to be showing any actual spikes so it seems you were right and my original diagnosis of CPU spikes being the problem was incorrect, I now suspect IO wait. I don't recall this happening for the brief few weeks I had Windows 7 Starter running on it though, which leads me to believe it isn't (just?) the hardware.. is there anything I can tweak to improve this? I'm using an Acer Aspire One D257, with Ubuntu 11.10.

Edit: Output of dmesg is at http://paste.ubuntu.com/1060054/ and kern.log is at http://paste.ubuntu.com/1060055/

Braiam
  • 69,112

4 Answers4

12

There are two additional tools that you may want to check out:

If you don't get what you want from those two tools, then you may need to use developer-tools like OProfile or Sysprof.

All the tools listed are available from ubuntu repositories

Regarding your observation with usb, from what I've heard, some usb-controllers behave a bit flaky with certain hardware which can cause Interrupt-storms, this could cause what you are describing. Try searching for usb interrupt storm and you will get quite a few hits.

Gerard Roche
  • 1,477
danjo133
  • 311
5

I used htop for years and I finally found how to get Cpu Utilization by numbers and percentages, I am surprised I have missed this.

htop iowait image

Press F2

Arrow to "Available meters"

Highlight CPU average

F5 or F6 to add to column

Arrow to the item "CPU [Bar]"

Press F4 till you get "CPU [Text]"

You can also get IORates

F2->Columns->Available

Add IO_RATE, IO_READ_RATE, IO_WRITE_RATE

Atherion
  • 151
2

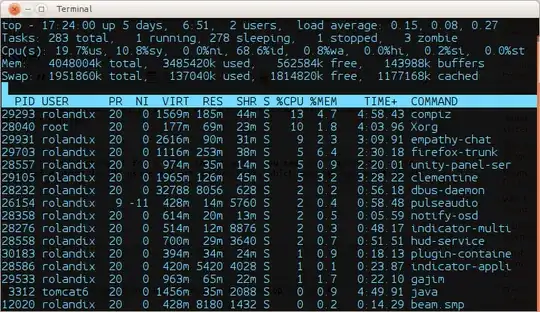
The best way to see this is to use a command-line application like top or htop Install htop.

top
top

htop
htop

You would need to be watching it for a while though until you see what causes the spike (if it is indeed a spike in CPU usage and not in i/o wait, which may not be caught in all cases).

RolandiXor
  • 51,797
2

A new and very helpful tool is cpustat It has a graphical interface that allows you to monitor multiple pids over time.

enter image description here

RickyA
  • 121