I am current writing a student experiment assignment in high school for science where I have an experimental and a theoretical dataset. I am confused if I should graph and analyse each dataset in individual graphs then compare the two in one graph (so I would have 3 total graphs and paragraphs), or if I should graph, analyse, and compare the datasets in one graph and one longer paragraph. With the one graph option, I would have to add 'experimental' or 'theoretical' before each data point for clarity, which would become repetitive and a waste of my word count. My teacher has not said anything on this before, as far as I remember, nor will they answer emails, and I can only see them after this assignment is due. I am unsure on what is best option for "scientific" writing would be.
1 Answers
If you want to compare the data, plot all graphs in the same diagram. Otherwise visual comparison will be impossible.
If the data are unrelated, plot them in separate graphs.
Examples
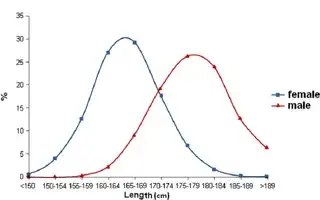
If, for example, you want to compare body height of men to body height of women, plotting the measured heights side by side as these authors have done results in a plot that is almost meaningless:
Those plots tell us nothing except that body height is normally distributed in both men and women. But if you plot the heights for both men and women in the same graph, as the following authors have done, you immediately see that body height of men and wommen differs an in what way:
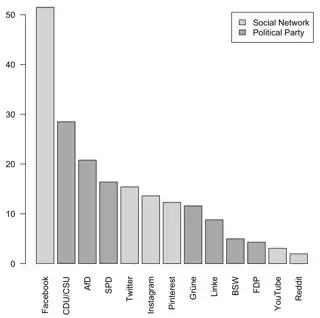
If, on the other hand, your data are unrelated, as the results from the last election and usage of social networks in Germany in the following diagram, showing them in the same plot makes absolutely no sense at all:
- 19,064
- 1
- 16
- 72


