Yongji
永济市 Yungtsi | |
|---|---|
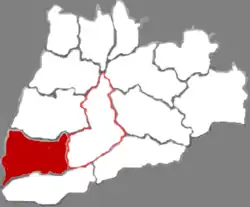 Location in Yuncheng | |
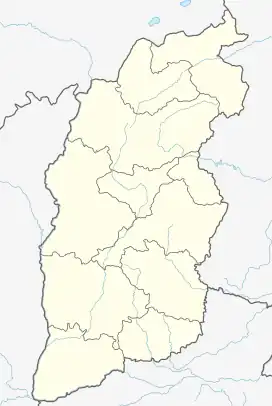 Yongji Location in Shanxi | |
| Coordinates: 34°52′01″N 110°26′53″E / 34.867°N 110.448°E | |
| Country | People's Republic of China |
| Province | Shanxi |
| Prefecture-level city | Yuncheng |
| Area | |
| • County-level city | 1,221.1 km2 (471.5 sq mi) |
| • Urban | 214.34 km2 (82.76 sq mi) |
| Population (2017) | |
| • County-level city | 452,000 |
| • Density | 370/km2 (960/sq mi) |
| • Urban | 171,000 |
| Time zone | UTC+8 (China Standard) |
| Website | www |
Yongji (simplified Chinese: 永济; traditional Chinese: 永濟; pinyin: Yǒngjì) is a county-level city in the prefecture-level city of Yuncheng, in the southwest of Shanxi province, China, bordering Shaanxi province to the west.
According to a census in 2011, the population in Yongji was 446,000.[2]
Climate
| Climate data for Yongji (1991–2020 normals, extremes 1981–2010) | |||||||||||||
|---|---|---|---|---|---|---|---|---|---|---|---|---|---|
| Month | Jan | Feb | Mar | Apr | May | Jun | Jul | Aug | Sep | Oct | Nov | Dec | Year |
| Record high °C (°F) | 15.5 (59.9) |
20.7 (69.3) |
29.8 (85.6) |
34.1 (93.4) |
39.6 (103.3) |
41.0 (105.8) |
41.1 (106.0) |
40.0 (104.0) |
40.2 (104.4) |
32.2 (90.0) |
24.2 (75.6) |
18.4 (65.1) |
41.1 (106.0) |
| Mean daily maximum °C (°F) | 5.5 (41.9) |
10.1 (50.2) |
16.5 (61.7) |
23.0 (73.4) |
28.1 (82.6) |
32.7 (90.9) |
33.2 (91.8) |
31.3 (88.3) |
26.5 (79.7) |
20.3 (68.5) |
13.1 (55.6) |
6.8 (44.2) |
20.6 (69.1) |
| Daily mean °C (°F) | −0.1 (31.8) |
3.9 (39.0) |
10.0 (50.0) |
16.3 (61.3) |
21.4 (70.5) |
26.1 (79.0) |
27.5 (81.5) |
25.8 (78.4) |
20.8 (69.4) |
14.5 (58.1) |
7.4 (45.3) |
1.2 (34.2) |
14.6 (58.2) |
| Mean daily minimum °C (°F) | −4.4 (24.1) |
−0.9 (30.4) |
4.6 (40.3) |
10.4 (50.7) |
15.3 (59.5) |
20.0 (68.0) |
22.6 (72.7) |
21.3 (70.3) |
16.3 (61.3) |
10.1 (50.2) |
2.9 (37.2) |
−3.1 (26.4) |
9.6 (49.3) |
| Record low °C (°F) | −13.6 (7.5) |
−14.3 (6.3) |
−8.5 (16.7) |
−1.2 (29.8) |
1.6 (34.9) |
11.1 (52.0) |
16.0 (60.8) |
13.0 (55.4) |
5.6 (42.1) |
−3.4 (25.9) |
−10.0 (14.0) |
−13.2 (8.2) |
−14.3 (6.3) |
| Average precipitation mm (inches) | 4.4 (0.17) |
8.0 (0.31) |
13.5 (0.53) |
35.6 (1.40) |
49.3 (1.94) |
54.4 (2.14) |
83.4 (3.28) |
74.5 (2.93) |
83.1 (3.27) |
52.4 (2.06) |
20.2 (0.80) |
3.7 (0.15) |
482.5 (18.98) |
| Average precipitation days (≥ 0.1 mm) | 2.9 | 3.2 | 4.4 | 6.2 | 7.7 | 7.4 | 8.9 | 8.5 | 9.4 | 7.7 | 5.2 | 2.5 | 74 |
| Average snowy days | 3.8 | 2.4 | 0.9 | 0 | 0 | 0 | 0 | 0 | 0 | 0 | 1.0 | 2.2 | 10.3 |
| Average relative humidity (%) | 57 | 56 | 54 | 57 | 57 | 58 | 69 | 73 | 74 | 72 | 68 | 59 | 63 |
| Mean monthly sunshine hours | 136.1 | 139.7 | 180.2 | 213.0 | 230.8 | 224.2 | 225.5 | 213.3 | 160.3 | 152.8 | 138.5 | 140.8 | 2,155.2 |
| Percent possible sunshine | 43 | 45 | 48 | 54 | 53 | 52 | 52 | 52 | 44 | 44 | 45 | 46 | 48 |
| Source: China Meteorological Administration[3][4] | |||||||||||||
References
- 1 2 Ministry of Housing and Urban-Rural Development, ed. (2019). China Urban Construction Statistical Yearbook 2017. Beijing: China Statistics Press. p. 46. Retrieved 11 January 2020.
- ↑ "永济人民政府". Archived from the original on August 20, 2013. Retrieved May 28, 2013.
- ↑ 中国气象数据网 – WeatherBk Data (in Simplified Chinese). China Meteorological Administration. Retrieved 26 August 2023.
- ↑ 中国气象数据网 (in Simplified Chinese). China Meteorological Administration. Retrieved 26 August 2023.
This article is issued from Wikipedia. The text is licensed under Creative Commons - Attribution - Sharealike. Additional terms may apply for the media files.