Qingyun County
庆云县 | |
|---|---|
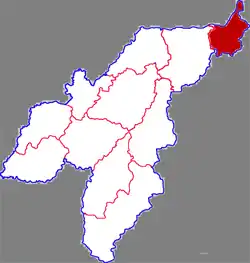 Qingyun in Dezhou | |
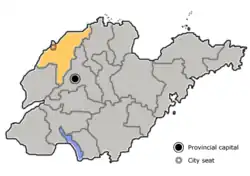 Dezhou in Shandong | |
| Coordinates: 37°46′31″N 117°23′07″E / 37.7754°N 117.3853°E | |
| Country | People's Republic of China |
| Province | Shandong |
| Prefecture-level city | Dezhou |
| Area | |
| • Total | 502 km2 (194 sq mi) |
| Population (2019)[2] | |
| • Total | 307,400 |
| • Density | 610/km2 (1,600/sq mi) |
| Time zone | UTC+8 (China Standard) |
| Postal code | 253700 |
Qingyun County (simplified Chinese: 庆云县; traditional Chinese: 慶雲縣; pinyin: Qìngyún Xiàn) is a county of north-northwest Shandong province, People's Republic of China, bordering Hebei province to the north. It is the northernmost county-level division of the prefecture-level city of Dezhou.
The population was 289,986 in 1999.[3]
Administrative divisions
As 2012, this County is divided to 1 subdistrict, 4 towns and 4 townships.[4]
- Subdistricts
- Bohailu Subdistrict (渤海路街道)
- Towns
|
|
- Townships
|
|
Climate
| Climate data for Qingyun (1991–2018 normals, extremes 1981–2010) | |||||||||||||
|---|---|---|---|---|---|---|---|---|---|---|---|---|---|
| Month | Jan | Feb | Mar | Apr | May | Jun | Jul | Aug | Sep | Oct | Nov | Dec | Year |
| Record high °C (°F) | 17.6 (63.7) |
20.5 (68.9) |
30.1 (86.2) |
31.2 (88.2) |
38.2 (100.8) |
41.0 (105.8) |
40.5 (104.9) |
35.8 (96.4) |
35.4 (95.7) |
30.8 (87.4) |
26.1 (79.0) |
17.0 (62.6) |
41.0 (105.8) |
| Mean daily maximum °C (°F) | 2.9 (37.2) |
6.7 (44.1) |
14.1 (57.4) |
20.7 (69.3) |
26.7 (80.1) |
31.4 (88.5) |
31.9 (89.4) |
30.3 (86.5) |
26.9 (80.4) |
20.6 (69.1) |
11.8 (53.2) |
4.5 (40.1) |
19.0 (66.3) |
| Daily mean °C (°F) | −2.9 (26.8) |
0.4 (32.7) |
7.4 (45.3) |
14.1 (57.4) |
20.3 (68.5) |
25.1 (77.2) |
26.9 (80.4) |
25.5 (77.9) |
20.8 (69.4) |
13.9 (57.0) |
5.8 (42.4) |
−1.1 (30.0) |
13.0 (55.4) |
| Mean daily minimum °C (°F) | −7.4 (18.7) |
−4.4 (24.1) |
1.7 (35.1) |
8.2 (46.8) |
14.1 (57.4) |
19.2 (66.6) |
22.6 (72.7) |
21.6 (70.9) |
15.9 (60.6) |
8.6 (47.5) |
1.1 (34.0) |
−5.3 (22.5) |
8.0 (46.4) |
| Record low °C (°F) | −18.5 (−1.3) |
−16.5 (2.3) |
−10.1 (13.8) |
−2.1 (28.2) |
5.0 (41.0) |
9.9 (49.8) |
16.7 (62.1) |
11.1 (52.0) |
5.7 (42.3) |
−3.1 (26.4) |
−12.0 (10.4) |
−20.0 (−4.0) |
−20.0 (−4.0) |
| Average precipitation mm (inches) | 3.7 (0.15) |
7.2 (0.28) |
6.6 (0.26) |
27.8 (1.09) |
42.0 (1.65) |
78.0 (3.07) |
185.2 (7.29) |
171.1 (6.74) |
44.5 (1.75) |
28.8 (1.13) |
18.3 (0.72) |
3.7 (0.15) |
616.9 (24.28) |
| Average precipitation days (≥ 0.1 mm) | 1.9 | 2.9 | 2.6 | 4.8 | 5.6 | 8.0 | 11.4 | 10.1 | 6.5 | 4.6 | 3.6 | 2.4 | 64.4 |
| Average snowy days | 2.6 | 3.1 | 1.0 | 0.2 | 0 | 0 | 0 | 0 | 0 | 0 | 0.9 | 1.8 | 9.6 |
| Average relative humidity (%) | 61 | 59 | 53 | 57 | 62 | 63 | 78 | 83 | 77 | 71 | 68 | 64 | 66 |
| Mean monthly sunshine hours | 152.0 | 160.3 | 226.2 | 237.4 | 270.8 | 238.9 | 201.6 | 204.5 | 201.5 | 188.2 | 161.8 | 153.6 | 2,396.8 |
| Percent possible sunshine | 50 | 52 | 61 | 60 | 61 | 54 | 45 | 49 | 55 | 55 | 54 | 52 | 54 |
| Source: China Meteorological Administration[5][6] | |||||||||||||
References
- ↑ 最新人口信息 www.hongheiku.com (in Chinese). hongheiku. Retrieved 2021-01-12.
- ↑ 最新人口信息 www.hongheiku.com (in Chinese). hongheiku. Retrieved 2021-01-12.
- ↑ National Population Statistics Materials by County and City - 1999 Period, in China County & City Population 1999, Harvard China Historical GIS
- ↑ 聊城市-行政区划网 www.xzqh.org (in Chinese). XZQH. Retrieved 2012-05-24.
- ↑ 中国气象数据网 – WeatherBk Data (in Simplified Chinese). China Meteorological Administration. Retrieved 12 August 2023.
- ↑ 中国气象数据网 (in Simplified Chinese). China Meteorological Administration. Retrieved 12 August 2023.
External links
This article is issued from Wikipedia. The text is licensed under Creative Commons - Attribution - Sharealike. Additional terms may apply for the media files.