Mapanas | |
|---|---|
| Municipality of Mapanas | |
 Flag  Seal | |
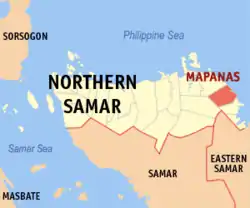 Map of Northern Samar with Mapanas highlighted | |
OpenStreetMap | |
.svg.png.webp) Mapanas Location within the Philippines | |
| Coordinates: 12°28′30″N 125°15′14″E / 12.475°N 125.254°E | |
| Country | Philippines |
| Region | Eastern Visayas |
| Province | Northern Samar |
| District | 2nd district |
| Barangays | 13 (see Barangays) |
| Government | |
| • Type | Sangguniang Bayan |
| • Mayor | Francis John L. Tejano |
| • Vice Mayor | Rogelio T. Longcop |
| • Representative | Jose L. Ong Jr. |
| • Councilors | List |
| • Electorate | 11,401 voters (2022) |
| Area | |
| • Total | 117.85 km2 (45.50 sq mi) |
| Elevation | 67 m (220 ft) |
| Highest elevation | 344 m (1,129 ft) |
| Lowest elevation | 0 m (0 ft) |
| Population (2020 census)[3] | |
| • Total | 14,234 |
| • Density | 120/km2 (310/sq mi) |
| • Households | 3,203 |
| Demonym | Mapanasnon |
| Economy | |
| • Income class | 5th municipal income class |
| • Poverty incidence | 42.53 |
| • Revenue | ₱ 86.41 million (2020) |
| • Assets | ₱ 305.4 million (2020) |
| • Expenditure | ₱ 95.19 million (2020) |
| • Liabilities | ₱ 44.3 million (2020) |
| Service provider | |
| • Electricity | Northern Samar Electric Cooperative (NORSAMELCO) |
| Time zone | UTC+8 (PST) |
| ZIP code | 6412 |
| PSGC | |
| IDD : area code | +63 (0)55 |
| Native languages | Waray Tagalog |
Mapanas, officially the Municipality of Mapanas (Waray: Bungto san Mapanas; Tagalog: Bayan ng Mapanas), is a 5th class municipality in the province of Northern Samar, Philippines. According to the 2020 census, it has a population of 14,234 people.[3]
Geography
Barangays
Mapanas is politically subdivided into 13 barangays. Each barangay consists of puroks and some have sitios.
Climate
| Climate data for Mapanas, Northern Samar | |||||||||||||
|---|---|---|---|---|---|---|---|---|---|---|---|---|---|
| Month | Jan | Feb | Mar | Apr | May | Jun | Jul | Aug | Sep | Oct | Nov | Dec | Year |
| Mean daily maximum °C (°F) | 27 (81) |
27 (81) |
28 (82) |
29 (84) |
30 (86) |
30 (86) |
30 (86) |
30 (86) |
29 (84) |
29 (84) |
28 (82) |
27 (81) |
29 (84) |
| Mean daily minimum °C (°F) | 23 (73) |
22 (72) |
22 (72) |
23 (73) |
24 (75) |
24 (75) |
24 (75) |
24 (75) |
24 (75) |
24 (75) |
24 (75) |
23 (73) |
23 (74) |
| Average precipitation mm (inches) | 105 (4.1) |
67 (2.6) |
65 (2.6) |
53 (2.1) |
86 (3.4) |
129 (5.1) |
135 (5.3) |
113 (4.4) |
131 (5.2) |
163 (6.4) |
167 (6.6) |
162 (6.4) |
1,376 (54.2) |
| Average rainy days | 17.6 | 13.2 | 15.5 | 14.9 | 19.6 | 24.3 | 26.6 | 25.4 | 24.9 | 25.4 | 22.9 | 20.9 | 251.2 |
| Source: Meteoblue[5] | |||||||||||||
Demographics
| Year | Pop. | ±% p.a. |
|---|---|---|
| 1970 | 5,716 | — |
| 1975 | 6,669 | +3.14% |
| 1980 | 5,549 | −3.61% |
| 1990 | 7,553 | +3.13% |
| 1995 | 9,377 | +4.14% |
| 2000 | 11,151 | +3.78% |
| 2007 | 12,221 | +1.27% |
| 2010 | 12,423 | +0.60% |
| 2015 | 14,025 | +2.34% |
| 2020 | 14,234 | +0.29% |
| Source: Philippine Statistics Authority[6][7][8][9] | ||
Economy
References
- ↑ Municipality of Mapanas | (DILG)
- ↑ "2015 Census of Population, Report No. 3 – Population, Land Area, and Population Density" (PDF). Philippine Statistics Authority. Quezon City, Philippines. August 2016. ISSN 0117-1453. Archived (PDF) from the original on May 25, 2021. Retrieved July 16, 2021.
- 1 2 Census of Population (2020). "Region VIII (Eastern Visayas)". Total Population by Province, City, Municipality and Barangay. Philippine Statistics Authority. Retrieved 8 July 2021.
- ↑ "PSA Releases the 2018 Municipal and City Level Poverty Estimates". Philippine Statistics Authority. 15 December 2021. Retrieved 22 January 2022.
- ↑ "Mapanas, Northern Samar : Average Temperatures and Rainfall". Meteoblue. Retrieved 6 January 2019.
- ↑ Census of Population (2015). "Region VIII (Eastern Visayas)". Total Population by Province, City, Municipality and Barangay. Philippine Statistics Authority. Retrieved 20 June 2016.
- ↑ Census of Population and Housing (2010). "Region VIII (Eastern Visayas)" (PDF). Total Population by Province, City, Municipality and Barangay. National Statistics Office. Retrieved 29 June 2016.
- ↑ Censuses of Population (1903–2007). "Region VIII (Eastern Visayas)". Table 1. Population Enumerated in Various Censuses by Province/Highly Urbanized City: 1903 to 2007. National Statistics Office.
{{cite encyclopedia}}: CS1 maint: numeric names: authors list (link) - ↑ "Province of Northern Samar". Municipality Population Data. Local Water Utilities Administration Research Division. Retrieved 17 December 2016.
- ↑ "Poverty incidence (PI):". Philippine Statistics Authority. Retrieved December 28, 2020.
- ↑ "Estimation of Local Poverty in the Philippines" (PDF). Philippine Statistics Authority. 29 November 2005.
- ↑ "2003 City and Municipal Level Poverty Estimates" (PDF). Philippine Statistics Authority. 23 March 2009.
- ↑ "City and Municipal Level Poverty Estimates; 2006 and 2009" (PDF). Philippine Statistics Authority. 3 August 2012.
- ↑ "2012 Municipal and City Level Poverty Estimates" (PDF). Philippine Statistics Authority. 31 May 2016.
- ↑ "Municipal and City Level Small Area Poverty Estimates; 2009, 2012 and 2015". Philippine Statistics Authority. 10 July 2019.
- ↑ "PSA Releases the 2018 Municipal and City Level Poverty Estimates". Philippine Statistics Authority. 15 December 2021. Retrieved 22 January 2022.
External links
- Philippine Standard Geographic Code
- Philippine Census Information
- Local Governance Performance Management System
Places adjacent to Mapanas | ||||||||||||||||
|---|---|---|---|---|---|---|---|---|---|---|---|---|---|---|---|---|
| ||||||||||||||||
Catarman (capital and largest municipality) | |
| Municipalities | |
This article is issued from Wikipedia. The text is licensed under Creative Commons - Attribution - Sharealike. Additional terms may apply for the media files.