| This article is part of a series on the |
| Politics of India |
|---|
 |
|

|
|
|
Elections in the Republic of India in 1983 included elections to six state legislative assemblies and to seats in the Rajya Sabha.
Legislative Assembly elections
Andhra Pradesh
| s.no | party | seats contested | seats won | seats change | vote share | swing |
|---|---|---|---|---|---|---|
| 1 | Telugu Desam Party | 289 | 202 | +202 | 46.3% | + 46.3% |
| 2 | Indian National Congress | 294 | 60 | -115 | 33.64% | -22.78% |
| 3 | Communist Party of India (Marxist) | 28 | 5 | -3 | 2.01% | -0.70% |
| 4 | Communist Party of India | 48 | 6 | +3 | 2.79% | +0.30% |
| 5 | Bharatiya Janata Party | 81 | 3 | +3 | 2.76% | +2.76% |
| 6 | Janata Party | 44 | 1 | -59 | 0.96% | -27.89% |
| 7 | others | 1100 | 20 | +5 | 5.00% | -4.20% |
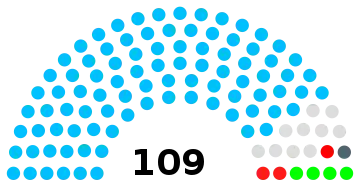
Assam
 | |||||
|---|---|---|---|---|---|
| Party | Votes | % | Seats | +/– | |
| Indian National Congress | 1,194,657 | 52.53 | 91 | +65 | |
| Indian Congress (Socialist) | 137,685 | 6.05 | 4 | New | |
| Communist Party of India (Marxist) | 116,923 | 5.14 | 2 | –9 | |
| Plain Tribals Council of Assam | 106,084 | 4.66 | 1 | –3 | |
| Communist Party of India | 58,746 | 2.58 | 1 | –4 | |
| Independents | 659,995 | 29.02 | 10 | –5 | |
| Total | 2,274,090 | 100.00 | 109 | –21 | |
| Valid votes | 2,274,090 | 95.34 | |||
| Invalid/blank votes | 111,100 | 4.66 | |||
| Total votes | 2,385,190 | 100.00 | |||
| Registered voters/turnout | 7,284,612 | 32.74 | |||
| Source: ECI[1] | |||||
Delhi
| Political Party |
No. of candidates |
No. of elected |
Number of Votes |
% of Votes | |
|---|---|---|---|---|---|
| Indian National Congress | 56 | 34 | 856,055 | 47.50% | |
| Bharatiya Janata Party | 50 | 19 | 666,605 | 36.99% | |
| Lok Dal | 6 | 2 | 73,765 | 4.09% | |
| Janata Party | 37 | 1 | 65,980 | 3.66% | |
| Total | 400 | 56 | 1,802,118 |
Jammu and Kashmir
Karnataka
| Political Party |
Seats Contested |
Seats Won |
Number of Votes |
% of Votes |
Seat change | |
|---|---|---|---|---|---|---|
| Janata Party | 193 | 95 | 4,272,318 | 33.07% | ||
| Indian National Congress | 221 | 82 | 5,221,419 | 40.42% | ||
| Bharatiya Janata Party | 110 | 18 | 1,024,892 | 7.93% | ||
| Communist Party of India | 7 | 3 | 161,192 | 1.25% | ||
| Communist Party of India (Marxist) | 4 | 3 | 115,320 | 0.89% | ||
| All India Anna Dravida Munnetra Kazhagam | 1 | 1 | 16,234 | 0.13% | ||
| Independents | 751 | 22 | 1,998,256 | 15.47% | ||
| Total | 1365 | 224 | 12,919,459 |
Meghalaya
| Parties and coalitions | Popular vote | Seats | ||||
|---|---|---|---|---|---|---|
| Votes | % | ±pp | Won | +/− | ||
| Indian National Congress (INC) | 130,956 | 27.68 | 1.64 |
25 | 5 | |
| All Party Hill Leaders Conference (AHL) | 118,593 | 24.92 | 0.15 |
15 | 1 | |
| Hill State People's Democratic Party (HDP) | 91,386 | 19.32 | 0.08 |
15 | 1 | |
| Public Demands Implementation Convention (PDIC) | 23,253 | 4.92 | 2 | |||
| Communist Party of India | 2,442 | 0.52 | 0.1 |
0 | ||
| Independents (IND) | 106,378 | 22.49 | 2.33 |
3 | 5 | |
| Total | 473,050 | 100.00 | 60 | ±0 | ||
| Source: Election Commission of India[4] | ||||||
a In the 1978 election, two candidates from the PDIC were elected, but the party had not obtained registration in time for the election; at that time, the party's representatives were recorded as independents in the official results.[5]
b Does not include the two PDIC candidates elected as independents in 1978.
Tripura
| Party | Seats Contested | Seats Won | No. of Votes | % of Votes | 1977 Seats |
|---|---|---|---|---|---|
| Bharatiya Janata Party | 4 | 0 | 578 | 0.06% | - |
| Communist Party of India | 1 | 0 | 7,657 | 0.83% | 0 |
| Communist Party of India (Marxist) | 56 | 37 | 433,608 | 46.78% | 51 |
| Indian Congress Secular | 3 | 0 | 540 | 0.06% | - |
| Indian National Congress | 45 | 12 | 282,859 | 30.51% | 0 |
| Janata Party | 5 | 0 | 515 | 0.06% | 0 |
| All India Forward Block | 1 | 0 | 6,549 | 0.71% | 1 |
| Revolutionary Socialist Party | 2 | 2 | 15,218 | 1.64% | 2 |
| Tripura Upajati Juba Samiti | 14 | 6 | 97,039 | 10.47% | 4 |
| Independents | 75 | 3 | 82,443 | 8.89% | 2 |
| Total | 206 | 60 | 927,006 |
Rajya Sabha
References
- ↑ "Statistical Report on General Election, 1983 to the Legislative Assembly of Assam". Election Commission of India. Retrieved 10 February 2022.
- ↑ Election Commission of India. STATISTICAL REPORT ON GENERAL ELECTION, 1983 TO THE LEGISLATIVE ASSEMBLY OF DELHI
- ↑ "Statistical Report on General Election, 1983 to the Legislative Assembly of Karnataka" (PDF). Election Commission of India.
- ↑ "Meghalaya 1983". Election Commission of India. Retrieved 2 April 2020.
- ↑ Gupta, Susmita Sen (2005). Regionalism in Meghalaya. South Asian Publishers. p. 118. ISBN 978-81-7003-288-5.
- ↑ "1983 Tripura Election result".
External links
| General elections | |
|---|---|
| State elections |
|
| |
This article is issued from Wikipedia. The text is licensed under Creative Commons - Attribution - Sharealike. Additional terms may apply for the media files.