| |||||||||||||||||
| Turnout | 94.38% | ||||||||||||||||
|---|---|---|---|---|---|---|---|---|---|---|---|---|---|---|---|---|---|
| |||||||||||||||||
| |||||||||||||||||
| Elections in Michigan |
|---|
 |
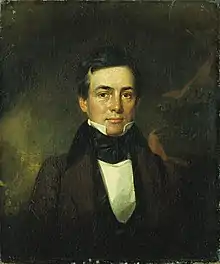
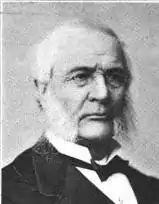
The 1837 Michigan gubernatorial election was held from November 6, 1837 to November 7, 1837. Incumbent Democrat Stevens T. Mason defeated Whig nominee Charles C. Trowbridge with 51.29% of the vote.
General election
Candidates
Major party candidates
- Stevens T. Mason, Democratic
- Charles C. Trowbridge, Whig
Results
| Party | Candidate | Votes | % | |
|---|---|---|---|---|
| Democratic | Stevens T. Mason (incumbent) | 15,314 | 51.29 | |
| Whig | Charles C. Trowbridge | 14,546 | 48.71 | |
| Total votes | 29,860 | 100 | ||
| Democratic hold | ||||
Results By County
Results provided by.[2]
Note: Counties listed may not match modern-day county names or borders. Names, vote numbers and percentages taken from above reference.
| County | Stevens T. Mason (D) | Charles Towbridge (W) | ||
|---|---|---|---|---|
| Percentage | Votes | Percentage | Votes | |
| Allegan | 31% | 98 | 69% | 218 |
| Berrien | 48.1% | 495 | 51.9% | 534 |
| Branch | 66% | 387 | 34% | 199 |
| Calhoun | 54.9% | 808 | 45.1% | 664 |
| Cass | 45.8% | 388 | 54.2% | 459 |
| Chippewa | 85.7% | 42 | 14.3% | 7 |
| Genesee | 48% | 233 | 52% | 252 |
| Hillsdale | 50.3% | 378 | 49.7% | 374 |
| Ionia | 61.9% | 148 | 38.1% | 91 |
| Jackson & Ingham | 45.4% | 758 | 54.6% | 911 |
| Kalamazoo | 43.4% | 577 | 56.6% | 752 |
| Kent | 75.6% | 394 | 24.4% | 127 |
| Lapeer | 48.5% | 227 | 51.5% | 241 |
| Lenawee | 51.4% | 1,345 | 48.6% | 1,273 |
| Livingston | 56.5% | 443 | 43.5% | 341 |
| Macomb | 40.6% | 471 | 59.4% | 689 |
| Michilimackinac | 67.4% | 89 | 32.6% | 43 |
| Monroe | 60.3% | 999 | 39.7% | 657 |
| Oakland | 50.6% | 1,681 | 49.4% | 1,639 |
| St. Clair | 54.3% | 447 | 45.7% | 376 |
| St. Joseph | 53.1% | 557 | 46.9% | 491 |
| Saginaw | 46.7% | 86 | 53.3% | 98 |
| Shiawassee | 47.9% | 123 | 52.1% | 134 |
| Van Buren | 56.9% | 103 | 43.1% | 78 |
| Washtenaw | 49.7% | 2,039 | 50.3% | 2,066 |
| Wayne | 49.1% | 1,998 | 50.9% | 2,066 |
| Totals* | 50.9% | 15,314 | 49.1% | 14,780 |
The Totals are stated, but the author included Whig candidate's Total Vote share at 14,546.
References
- ↑ "Our Campaigns - MI Governor - Nov 06, 1837". Our Campaigns. Retrieved November 26, 2019.
- ↑ "United States Gubernatorial Elections, 1776 1860: The Official Results By State And County | archive.org". May 20, 2022. Retrieved May 4, 2023.
This article is issued from Wikipedia. The text is licensed under Creative Commons - Attribution - Sharealike. Additional terms may apply for the media files.