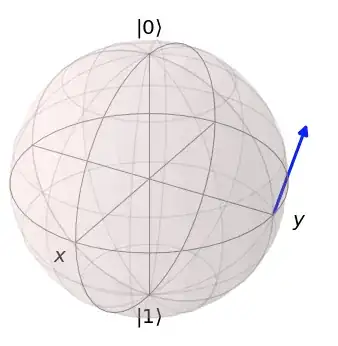
I need to plot drawings of qubit dynamics on the Bloch sphere. I know QuTip allows to do such drawings but I specifically need to represent evolution velocities on the Bloch sphere so I need to draw tangent vectors. Is there a way I can do it with QuTip? More generally it would be good to be able to draw affine vectors with QuTip. Do you know of any way I can do it? If this cannot be done with QuTip do you know of any other software that allows me to do it?
1 Answers
First of all, qutip is not a visualisation library, even though it does provide some visualisation functionalities, mostly leveraging matplotlib.
However, because qutip does provide handy functionalities to plot Bloch spheres and points on it, it does make sense to ask how one can tweak such functionalities to for example add tangent vectors to the bloch sphere.
Reading the relevant doc page, this functionality does not seem to have been implemented. However, having a look at the relevant source code, it does not seem particularly difficult to add manually additional vectors to the Bloch sphere.
In particular, at least in the current version of qutip, the vectors are added via the method plot_vectors, which creates the arrows using an Arrow3D object.
One can add any other vector to the sphere by simply adding new Arrow3D objects to the underlying matplotlib axes object.
Here is an example of how to do this:
import matplotlib.pyplot as plt
%matplotlib inline
import qutip
b = qutip.Bloch()
b.render(b.fig, b.axes)
new_arrow = qutip.bloch.Arrow3D(xs=[1, 1], ys=[0, .5], zs=[0, .5],
                    mutation_scale=b.vector_mutation,
                    lw=b.vector_width, arrowstyle=b.vector_style, color='blue')
b.axes.add_artist(new_arrow)
which gives
note that we need to call explicitly b.render instead of b.show because we need the axes object to be created but the plot to not be drawn before we add the new arrow.
Just change the coordinates given to the parameters xs, ys, zs to decide what vectors to draw.
As a final more or less unrelated note, you might also be interested in the drawing library plotly, which allows to build very nice 3d plots (see e.g. these examples).
- 27,510
- 7
- 37
- 125
