The code is from https://github.com/qiskit-community/qiskit-algorithms/blob/stable/0.3/docs/tutorials/13_trotterQRTE.ipynb.
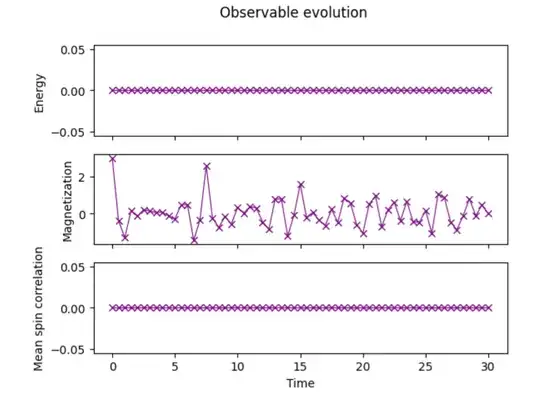
While simulating many-body system evolving under a transverse field Ising hamiltonian, when I change the initial state from 6 spins of "001100" to 5 spins of "00010" and change the Hamiltonian from H = get_hamiltonian(L=L, J=0.2, h=1.2, alpha=pi / 8) to H = get_hamiltonian(L,1,1.7,0) , then the graph looks like this: 
This is unexpected and nothing like the graph from the link page. I do not know hot to explain this. And it is not because the alpha is set to 0. When I set the initial state to other states, there is not a straight line for energy and spin correlation. They look like graphs in the link above.
For a simple hamiltonian like this, why certain initial state would display such non-trivial hamiltonian evolution. Is there an intuitive explanation for this? Why is the state "00010" special?
The graph is reproducible from the code above.