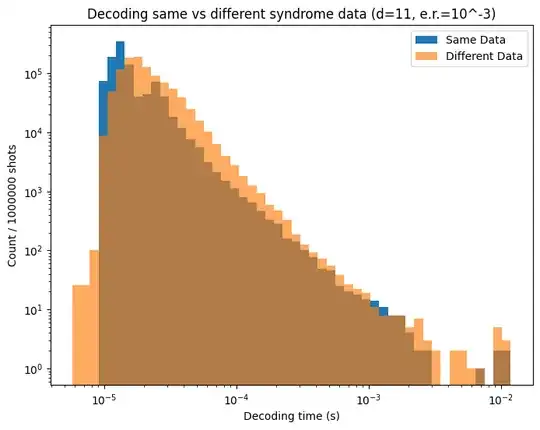
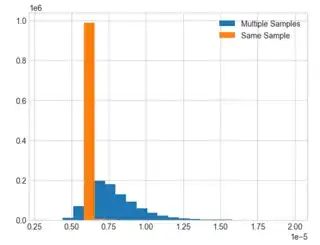
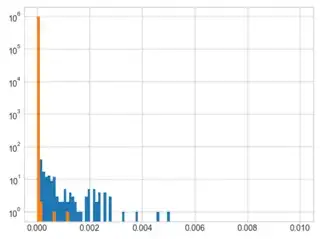
I am interested in looking into histogram distributions of decoder timing for different syndrome inputs (sourced from stim) into pymatching. Unfortunately, it seems the histograms I product are more a function of how my PC runs the simulations vs actual differences in how pymatching handles different syndrome inputs. As an example, I produced two overlaid timing histograms below to show what I am talking about.
Orange shows decoding times for different stim output syndromes, while blue shows the decoding times for decoding the same syndrome data over and over. Given the very close agreement, it seems that any data I get with how I am doing this tells me absolutely nothing about the syndrome input's effect on decoding times.
I am wondering if anyone knows why this is happening. Maybe a problem with my implementation? Does pymatching use some randomness in its decoding process? Maybe to select the first root to start an alternating tree. If so is it possible to define a seed? Maybe relying on python for such sensitive timing was doomed to fail from the start.
Here is the code used to generate the data above, changing the distance or error rate input changes the exact distribution, but the agreement is always quite good with rare exception. There is a chance of getting an syndrome set that is actually more difficult to decode, and if that is the first shot of the sampler then the blue distribution can be shifted to higher times.
# Inputs
distance = 11
reps = 11
shots = 1000000
noise = 1e-3
Define circuit and matching graph
circuit = stim.Circuit.generated(
    'surface_code:rotated_memory_z',
    rounds=reps,
    distance=distance,
    after_clifford_depolarization=noise,
    after_reset_flip_probability=noise,
    before_measure_flip_probability=noise,
    before_round_data_depolarization=noise
)
error_model = circuit.detector_error_model(decompose_errors=True)
match = pm.Matching.from_detector_error_model(error_model)
Sample results
sampler = circuit.compile_detector_sampler()
syndromes, observables = sampler.sample(shots, separate_observables=True)
int_syndromes = np.array(syndromes).astype(dtype='uint8')
Decoding number of shots
times_same_data, times_different_data = [], []
for s in range(shots):
    same_start = time.time()
    match.decode(int_syndromes[0])
    same_end = time.time()
    times_same_data.append(same_end - same_start)
different_start = time.time()
match.decode(int_syndromes[s])
different_end = time.time()
times_different_data.append(different_end - different_start)


