0

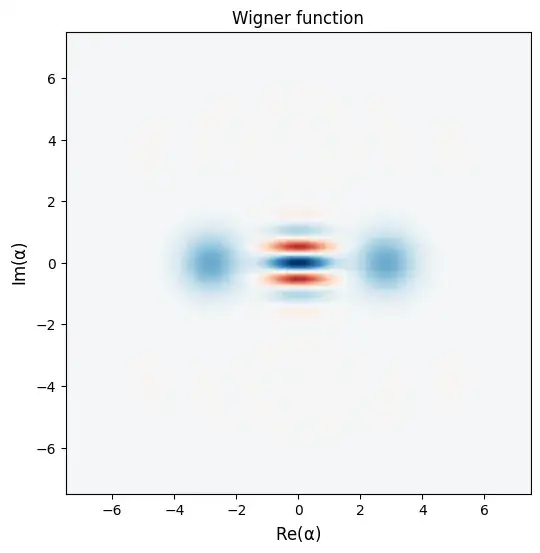
In QuTiP, it is possible to plot Wigner functions with positive (shown in blue) and negative (shown in red) values.

For example, the following code displays the Wigner function of a Schrodinger cat state :

import matplotlib.pyplot as plt
from qutip import plot_wigner, coherent

N, alpha = 20, 2 fig, ax = plot_wigner(coherent(N, alpha)+coherent(N, -alpha)) plt.show()

Output:

Wigner function

Would it be possible to invert the color bar to get positive values in red and negative ones in blue ?
francois-marie
  • 351
  • 2
  • 11

1 Answers1

1

Adapted from this answer :

import numpy as np
import matplotlib.pyplot as plt
from matplotlib import cm
from matplotlib.colors import ListedColormap
from qutip import plot_wigner, coherent
# Red, Green, Blue
N = 256
vals = np.ones((N, 4))
# Blue stays constant until middle of colormap all other channels increase
# to result in white
# from middle of colormap we decrease to 255, 0, 0 which is red
inc = np.linspace(0, 1, N//2)
dec = np.linspace(1, 0, N//2)
cst = np.linspace(1, 1, N//2)
vals[:, 0] = np.concatenate((inc, cst), axis=None)
vals[:, 1] = np.concatenate((inc, dec), axis=None)
vals[:, 2] = np.concatenate((cst, dec), axis=None)
newcmp = ListedColormap(vals)

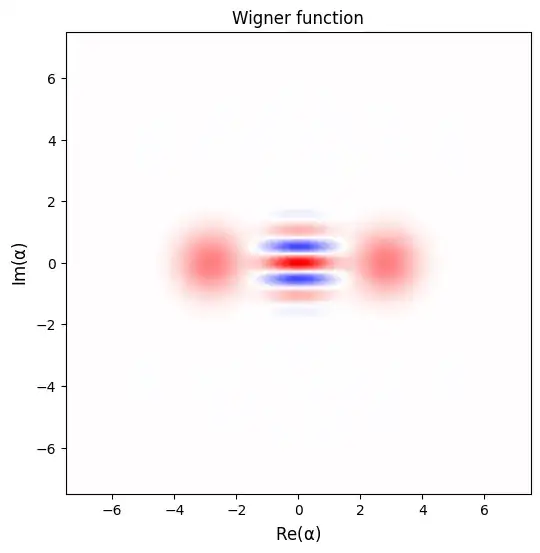
N, alpha = 20, 2 fig, ax = plot_wigner(coherent(N, alpha)+coherent(N, -alpha), cmap=newcmp) plt.show()

Output

Wigner function

francois-marie
  • 351
  • 2
  • 11