Is there any function I can call to visualize a stim circuit?
Asked
Active
Viewed 1,317 times
2 Answers
5
Since v1.10, you can use stim.Circuit.diagram to visualize the circuit.
import stim
circuit = stim.Circuit("""
    QUBIT_COORDS(0, 0) 0
    QUBIT_COORDS(0, 1) 1
    QUBIT_COORDS(1, 0) 2
    QUBIT_COORDS(1, 1) 3
    R 0 1 2 3
    H 0 2
    CNOT 0 1
    CNOT 2 3
    M 0 1 2 3
""")
print(circuit.diagram())
q0: -QUBIT_COORDS(0,0)-R-H-@-M:rec[0]- | q1: -QUBIT_COORDS(0,1)-R---X-M:rec[1]-q2: -QUBIT_COORDS(1,0)-R-H-@-M:rec[2]- | q3: -QUBIT_COORDS(1,1)-R---X-M:rec[3]-
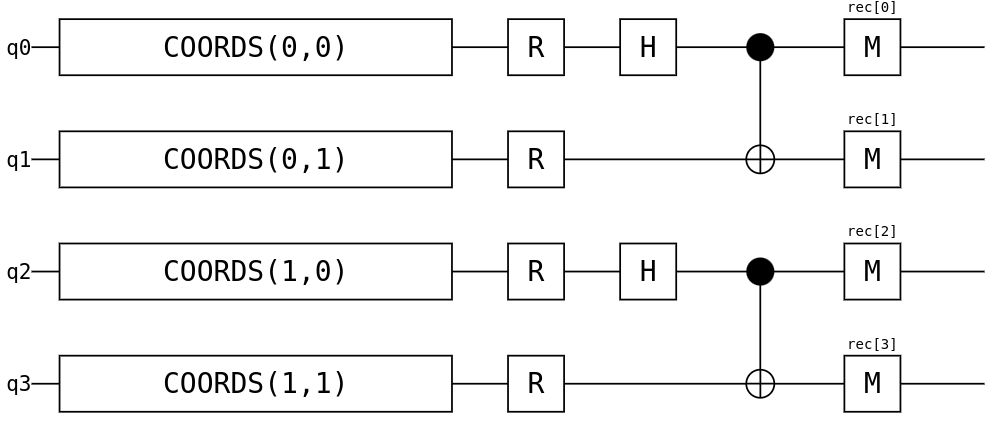
You can also get an SVG image of the timeline:
circuit.to_diagram(type="timeline-svg")
In Jupyter notebooks this SVG will display inline. Otherwise you have to print it to a .svg file then open it.
or a 3d model, optionally embedded into a viewer that can be opened in a web browser:
# for this one you really want to have specified qubit coords
circuit.to_diagram(type="timeline-3d-html")
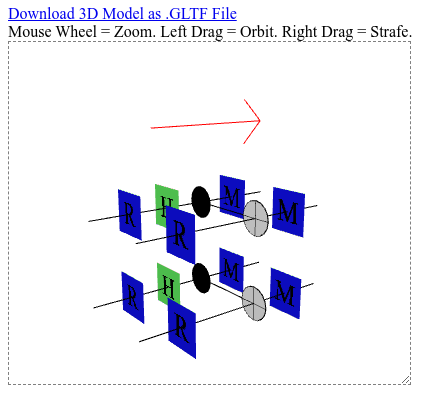
In Jupyter notebooks this viewer will display inline in the cell output. Otherwise you have to print it to a .html file then open it.
The diagram types that are currently available are:
    timeline-text
    timeline-svg
    timeline-3d
    timeline-3d-html
    match-graph-svg
    match-graph-3d
    match-graph-3d-html
    detector-slice-text
    detector-slice-svg
You can also use the stimcirq package to convert into a cirq circuit and get diagrams that way (e.g. with the cirq_web package).
Craig Gidney
- 44,299
- 1
- 41
- 116
3
You can use stimcirq to convert your Stim circuit into a Cirq circuit then visualize it:
import stim
import stimcirq
cirq_circuit = stimcirq.stim_circuit_to_cirq_circuit(stim_circuit)
print(cirq_circuit)
Egretta.Thula
- 11,986
- 1
- 13
- 34