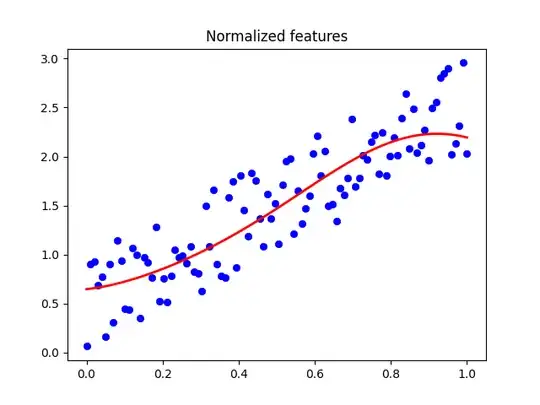
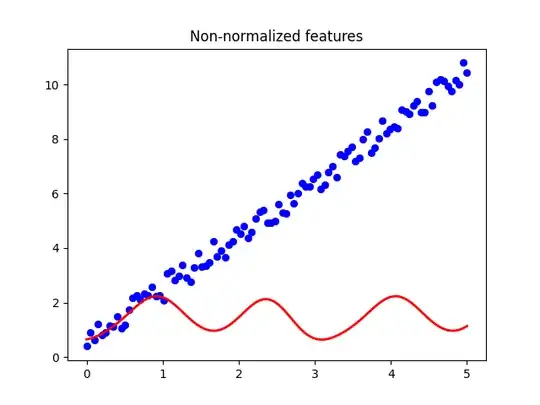
I'm implementing a kernel ridge regressor using qiskit's FeatureMap and QuantumKernel to compute the alpha parameters of the solution. If I try to fit my model with non-normalized features I obtain strange, nonlinear patterns in my predictions. To compute my solutions I'm using the default formulation I found here


This is the code I used to produce these results:
from qiskit import BasicAer
from qiskit.circuit.library import ZFeatureMap
from qiskit.utils import QuantumInstance
from qiskit_machine_learning.kernels import QuantumKernel
import numpy as np
import matplotlib.pyplot as plt
class QuantumRidge:
    def init(self, gamma, quantum_instance, feature_map):
        self.q_kernel = QuantumKernel(feature_map=feature_map,
                                 quantum_instance=quantum_instance)
        self.gamma = gamma
def fit(self, X_train, y_train):
    self.X_train = X_train
    n_train = y_train.size
    I = np.eye(n_train)
    K_train = self.q_kernel.evaluate(x_vec=X_train)
    K_train = K_train + self.gamma * I
    self.alpha = np.linalg.solve(K_train, y_train)

def predict(self,X_test):
    K_test = self.q_kernel.evaluate(self.X_train, X_test).T
    prediction = K_test @ self.alpha
    return prediction


quantum_instance = QuantumInstance(BasicAer.get_backend('statevector_simulator'), shots=512)
feature_map = ZFeatureMap(2)
x_lin = np.linspace(0, 1,100).reshape(-1,1)
Normalized
qr_norm = QuantumRidge(1,quantum_instance,feature_map)
X_norm = np.hstack([x_lin,x_lin])
y_norm = np.sum(X_norm,axis=1) + np.random.random(X_norm.shape[0])
qr_norm.fit(X_norm,y_norm)
y_pred = qr_norm.predict(X_norm)
plt.title("Normalized features")
plt.scatter(X_norm[:,0],y_norm,linewidth=0.5,c="b")
plt.plot(X_norm[:,0],y_pred,linewidth=2,c="r")
plt.show()
Scaled
scale = 5
qr_scaled = QuantumRidge(1,quantum_instance,feature_map)
X_scaled = np.hstack([x_lin,x_lin]) * scale
y_scaled = np.sum(X_scaled,axis=1) + np.random.random(X_scaled.shape[0])
qr_scaled.fit(X_scaled,y_scaled)
y_pred = qr_norm.predict(X_scaled)
plt.title("Non-normalized features")
plt.scatter(X_scaled[:,0],y_scaled,linewidth=0.5,c="b")
plt.plot(X_scaled[:,0],y_pred,linewidth=2,c="r")
plt.show()
Why does this happen? I suspect it's caused by the way QuantumKernel computes the matrix.