I asked a version of this question over on Math.SX, and never received a response… perhaps it will be more appropriate here.
I'm looking at spectroscopic data (specifically a $T_2$ coherence decay curve of some NMR data). Normally, this data is fit to a single or multi-exponential decay to account for multiple components. However, I have a data set that fits best to a function with a power in the exponent near 1.4 (in between a Gaussian and single exponential decay).
Is there any physical meaning for generalized normal distribution functions? To elaborate on what I mean by "physical meaning", when working with spectroscopic absorptions, an an exponential decay (n=1) indicates a system with homogeneous broadening of lifetimes, while a Gaussian decay indicates inhomogenous broadening of lifetimes. What does a power between these two values indicate? Is there a precedent for using this sort of peak shape (or decay function in this case) in spectroscopic analysis?
--EDIT--
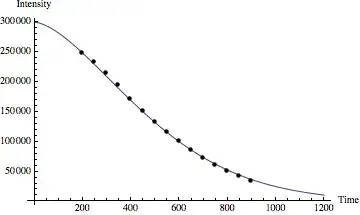
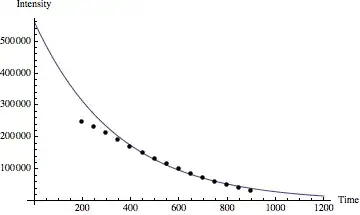
To demonstrate the phenomenon, here are a couple of sample curves with some data. The depressed points at the start may be an experimental artifact, but I'd still be curious to know if there is any physical precedent for the exponential power between 1 and 2.
$e^{-t/T_2}$
$e^{-(t/T_2)^{1.6}}$