I have a master's degree in meteorology so I think I can clear this up for you!
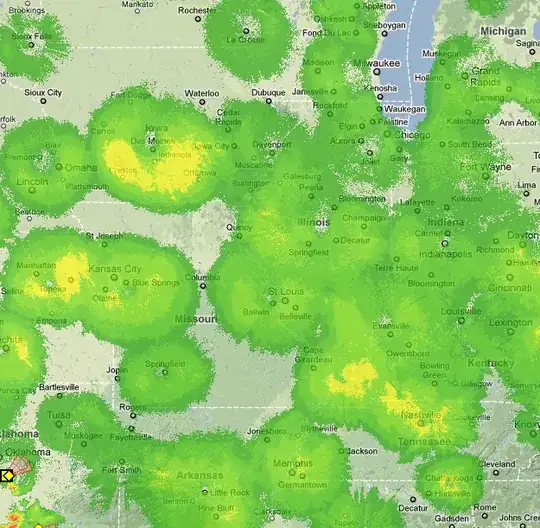
This is simply ground clutter. You will see this sort of thing happening on evenings where the relative humidity is very high, more so when the mixing ratio is high also. The radar beam can actually start to interact with water droplets in the air when your humidity values are very high. You are more likely to max out your humidity values during the night as the air temperature falls and approaches the dewpoint. Indeed, if you look at the image I posted below you will see that in the area your radar image depicts, the relative humidities are near 100% in most of these areas. You can see that in many areas the temperature/dewpoint ratio is near 100%. For example, there are values on the map such 44/40, 55/54, 57/54, 50/49...very humid.
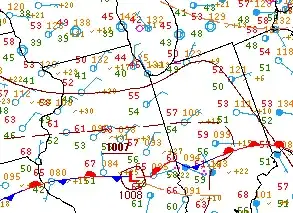
(Surface Analysis on May 8, 2011 0300Z(10PM CDT). Image is taken from http://www.hpc.ncep.noaa.gov/html/sfc_archive.shtml where you can then retrieve the surface analysis for any day you wish through March 30, 2006.