1

Is Cosmic ray flux taking into account (or not?) the detector efficiency or should we consider this additional factor (in a multiplicative way) in order to predict average number of detected particles ?

reference: wikipedia:

https://en.wikipedia.org/wiki/Cosmic_ray

enter image description here

2 Answers2

2

The image you displayed of the cosmic ray flux is a smoothed version of the actual observed measurements taken by a variety of sources (Fermi-LAT, PAMELA, ATIC, AMS-02, HESS, Auger, etc) using both direct and indirect methods (e.g., in some observatories the cosmic rays themselves are detected, in others it is the secondary air showers in the atmosphere that are observed). The charts that you would see in publications will come with error bars, denoting the variety of statistical and systematic uncertainties (including efficiencies), and would look something like this: Cosmic Ray Fluxes
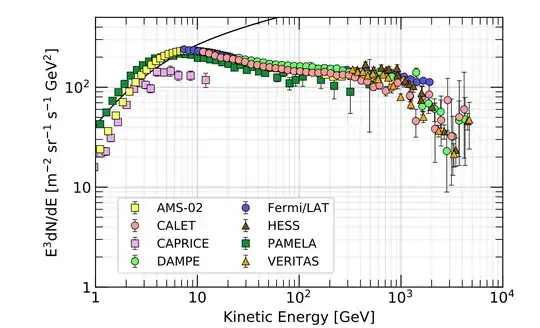
(source: PDG, Phys Rev D (2019) )--note this is only going to ~$10^{15}$ eV, so it's eliminating the ultra high energy particles observed with HESS & Auger.

I suspect that by eliminating these uncertainties and using a smoothed curve, the chart you are questioning is highlighting the fact that the energetics of the cosmic rays follow a power law distribution in energy, $$N(E)\propto E^{-\gamma}$$ (cf. this answer of mine for some background on the use of a power law in cosmic rays).

Kyle Kanos
  • 29,127
0

I think this flux over energy plot about cosmic rays is a bit idealized for many reasons. Here are my two cents that could help to find a full answer.

  1. Cosmic rays is a term for a manifold of various particles. There is not the one cosmic ray. You'll have primary cosmic rays like protons, electrons, alphas, neutrinos, and many more, traveling through the universe and secondary cosmic rays like neutrons, muons, pions etc measurable on Earths surface.
  2. There are specific detectors for specific particles and energies, there is no general cosmic ray detector. However, there are detector types which can detect several different (but not all) cosmic-ray particles including their charge, like the AMS-02.
  3. Every detector type is different due to geometry, shielding, housing, gas pressure, etc. Hence, every detector has different energy sensitivity, called detector response functions (drf). They can be determined by experiments or simulation, and once you know them, use them to determine the true particle yield by folding the source (this image) with the drf.
  4. Many of those energy ranges in the image are extremely hard to detect. So I would guess that the lines are based on various datasets (using various detectors) that have been determined by a combination of direct and indirect methods, e.g. fitting of data from a handful of different detectors on satellite missions in space or on Earths surface. For very high energies, there might be an influence of extrapolation or modeling.

For these reasons, the count rates of the different detectors needs to be normalized to be comparable. I.e., the data has likely been unfolded using the detector-specific drfs before going into this plot. Long story short, my guess is that you need to fold these fluxes with your own detectors drf to get a realistic count rate.

In Wikipedia, the image author mentioned Swordy (2001) and de Angelis and Pimenta (2018) as the basis for this plot. You may want to read therein to find out more (and share with us ;-).

  • Swordy, The energy spectra and anisotropies of cosmic rays, 2001, Space Science Reviews 99, pp85–94.
  • A. de Angelis and M. Pimenta, Introduction to particle and astroparticle physics (Multimessenger astronomy and its particle physics foundations), Springer 2018, p577.
Martin
  • 1,126