I'm familiar with QFT at the level of QFT by Ryder. I have also consulted many books including QFT by Fradkin which includes $O(N)$ vector model, particularly in $\phi^4$, and nonlinear sigma model, as well as large $N$, even going briefly into planar diagrams and how each Feynman diagram scales in terms of the coupling constant. However, I find the explanation in Fradkin extremely confusing and too brief.
I have also consulted a chapter in a book compiling papers on recent studies in perturbation theory. It came the closest to explaining some stuff just mentioned quickly in Fradkin, however, since the chapter is structured more like a review I still don't understand the detail. An example would be, for $\phi^4$ where $\phi$ has $N$ components, the chapter discussed that the interaction vertex should be drawn as,
where the left-image is the standard interaction vertex if $N=1$, while the right-image is for arbitrary $N$. In addition, for the two-point function, the contribution upto second-order is given by,
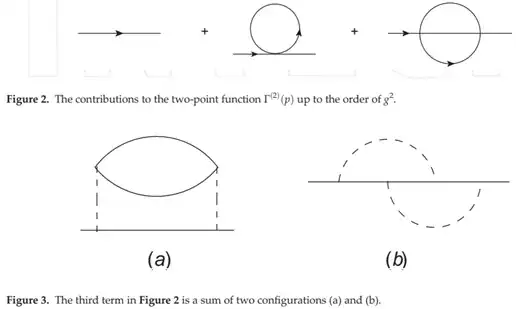
where the third diagram in fig.2 is actually a sum of two diagrams as shown in fig.3. The chapter also talked about the symmetry factors of the third diagram. Specifically, the diagram in fig.3a has a symmetry factor of $4^2 \cdot 2N = 32N$, while the diagram in fig.3b has a symmetry factor of $4^2 \cdot 2^2 = 64$. So the third diagram in fig.2 has a symmetry factor of $32N + 64$ in total.
What does the dashed line mean in Fig.1 and how does it work? Why is the third diagram a sum of two diagrams and how to decompose it? Not knowing even how to interpret the interaction vertex in fig.1 obviously leads me to not know how the symmetry factors work for the third diagram in fig.2. How to count the symmetry factors of those diagrams?
I would also like to ask for any recommendations on this topic that goes into detail such as the loop corrections, detailed explanation on the Feynman diagrams, etc.


