1

enter image description here

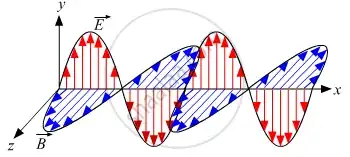
When I look for information about EM waves I see a lot of diagrams that look like this. But I find the interpretation of the x,y,z axis here a bit confusing.

I understand that there is an electric field that has a value at each point in space, and that value is a vector that describes a force that would be exerted on a charge.

So I see the red shaded area, is that (the length and direction of the arrow) telling me something about the "value" of the electric field at points in space along the y axis, or is it just telling me about the "force in the y direction" of a point along the x axis and this diagram tells me nothing about how the "value vectors" of the E field change if we were to drop a charge further into the y direction at a given x point?

In other words, if I know the value of x that I want to evaluate the field at, the length of the red arrow says "how hard" the E field is pushing in the y direction at that x point?

But if I was to pick an x point (assume y = 0) and then pick a point where y = 1 or 0.0001 or whatever but x is the same, then this diagram doesn't inherently suggest anything about how the vector direction would be different between the two points?
thepman
  • 13
  • 3

1 Answers1

1

In other words, if I know the value of $x$ that I want to evaluate the field at, the length of the red arrow says "how hard" the $E$ field is pushing in the $y$ direction at that $x$ point?

Correct.

But if I was to pick an $x$ point (assume $y = 0$) and then pick a point where $y = 1$ or $0.0001$ or whatever but $x$ is the same, then this diagram doesn't inherently suggest anything about how the vector direction would be different between the two points?

Correct. But a diagram like this is usually associated with an infinite plane wave. The behaviour of such infinite plane waves is such that there is no $y$ or $z$ dependencies, only $x$ dependency. i.e. for a given $x$ value, the everywhere on that entire $yz$ plane will see the exact same $E$ field and same $B$ field.

Of course, this infinite plane wave is an additional assumption that is not yet apparent in this diagram. However, if it is not an infinite plane wave, this diagram ought to be changed; it would not have a uniform amplitude, for example.

So I see the red shaded area, is that telling me something about the "value" of the electric field at points in space along the $y$ axis,

Easy, that is not an area at all. We have no choice but to plot many arrows to show you what we mean, but that unfortunately gives the impression of an area. That is a wrong impression; both the author and the reader cannot help this.

or is it just telling me about the "force in the $y$ direction" of a point along the $x$ axis and this diagram tells me nothing about how the "value vectors" of the $E$ field change if we were to drop a charge further into the $y$ direction at a given $x$ point?

Correct; see my reply to the 2nd quotation above.