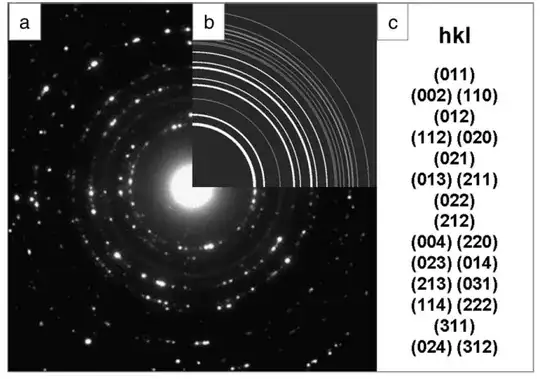
I am studying Transmission Electron Microscopy (TEM), and have been seeing in articles TEM images of different materials typically come accompanied by these diffraction patterns, caused by the interference of the electron beam with the crystalline domains. Bellow is an example of a polycrystalline sample (from this article), where we can see the diffraction pattern forms concentric ring patterns, instead of showing evenly spaced dots (which is what we would get in a monocrystalline structure).
One thing I cannot understand, however, is how the interatomic distances can be correlated to the Miller planes present in the sample. The articles I have found thus far are not clear about how the distances are derived from the SAED patterns, whether they are measured from the central focal point or between adjacent lines. Nor are they clear about how these values are correlated with the miller planes.
I know that for a cubic system, the interatomic distances are proportional to $d \propto \sqrt{h^2+ k^2 + l^2}$, and therefore a direct correlation can be drawn between each $(hkl)$ plane and their corresponding interatomic distance. So should you be measuring the distances between the concentric circles and correlate them to the Miller planes? And what about more complex structures, for example, trigonal or orthorhombic? Are there databases one can consult to draw these correlations? None of the articles I have seen seem to cite any, but I would assume there is some sort of tool one can use to derive the interatomic distances from, for example, a .cif file for more complex structure, instead of deriving it by hand.
