23

According to my textbook, this is how it works

All of this just doesn’t make sense though.

I mean, doesn’t the amplitude represent the loudness and the frequency the pitch? Aren’t they completely independent from each other?

Is the book just lacking information or am I just not getting something?

I probably don’t have enough insight on how this works, I know the material on a AS Level (for the brits out there), so roughly high school. If you use some advanced explanations please give me some links so I can understand the knowledge I need to have before actually reading your answer lol.

A.L
  • 111
RedP
  • 411

11 Answers11

57

"Amplitude" is the wrong word. The amplitude of a periodic function is the difference between its greatest value and its least value. Cross out "amplitude" from your textbook, and pencil in, "instantaneous value." For a strictly periodic function, "amplitude" is just a single number. For a signal, it's usually regarded as a value that changes slowly over time.

What the ADC hardware measures is not slowly-changing amplitude. The ADC measures the instantaneous value of the signal, and it measures it tens of thousands of times every second.

There's actually two blocks missing from the diagram. In between the left-hand "amplifier" block and the "ADC" block should be a block labelled "anti-aliasing filter," and in between the "DAC" block and the right-hand "amplifier" block should be a block labelled "reconstruction filter".*

The whole system—from one end to the other—is not only meant to reproduce the "amplitude" and the "frequencies" of the original signal. It's meant to faithfully reproduce every detail of the original waveform that your ears are able to percieve.


* Those filters are always present. Some part of the circuit and/or the transducers will be performing those functions regardless of whether or not the engineers who designed the electronic circuits were aware of it. The engineers who build crappy sound reproduction systems maybe are not aware of anti-aliasing and reproduction filters, but the engineers who design the high-quality stuff absolutely know all about them.

In a system with inadequate or un-designed reconstruction filtering, you may hear high-pitched "quantization noise", and in a system with an inadequate or un-designed anti-aliasing filter, you may hear other weird tones and artifacts.

Solomon Slow
  • 17,057
43

A slight clarification on Solomon Slow's complete answer:

If you sample the original signal frequently enough, the instantaneous values you measure at each of those tiny time slices will actually contain the frequency information which you can then recover by re-assembling the sample slices and playing them back in sequence.

For this to be true, the sampling rate must meet a mathematical condition called the Nyquist sampling criterion which basically states that to capture the frequency content you must sample it at a frequency at least twice that of the highest-frequency signal component you wish to catch. So for a digital audio recorder to detect a 20,000 Hz frequency, it has to sample the waveform at about 40,000 Hz.

niels nielsen
  • 99,024
30

Your instinct is correct, there are two degrees of freedom here so we have to measure two quantities. The one you are missing is the timestamp. We are measuring both the voltage of the signal and the time that that voltage occurs. As long as when we reproduce the signal we space the voltage measurements out with the same time steps as the original, we'll get back the frequency.

5

Your ears only hear one thing: the air pressure (technically, the difference between instantaneous and average air pressures) as a function of time: $P(t)$. To lightly edit your textbook:

During the process of converting an analogue sound into a digital recording, a microphone converts the sound energy into electrical energy. The analogue to digital converter (ADC) samples the analogue data at least 40,000 times per second, measuring the amplitude of the waveform at each instant and converting it to a binary value according to the resolution or audio bit depth being used for each sample.

Why the edits matter:

As was pointed out in another answer, young, healthy humans hear frequencies between 20 and 20,000 Hz, and by sampling at double the maximum, we can faithfully reconstruct high-frequency waveforms up to 20,000 Hz. I've described the sampling rate without the word frequency to clarify that it's not an audio phenomenon, despite having the same units. By describing $P(t)$ as a waveform, we can distinguish it from single sinusoid. Also note that audio waves are defined at instants (points in time) rather than points in space.

There are many difficult maths which help us understand the relationship between $P(t)$ and frequency. The important point for your question is that the frequency information is fully encoded in $P(t)$. Given $P(t)$, we can completely determine the frequency and phase information, and given the frequency and phase information, we can completely determine $P(t)$: they are not independent.

By the way, truly understanding all the math in the two links would get you a long way through university math physics, so don't sweat all the details yet - they're just for background.

user121330
  • 2,222
4

The textbook is using "amplitude" differently from the way you are thinking of it. You are correct that one use of "amplitude" is to describe half of the peak-to-peak distance of a sine wave. But, the text is using amplitude to mean the value the wave takes at some instant in time.

To answer your broader question, think about what the computer is actually doing. The first audio recorders were physical: sound would vibrate a membrane that was attached to a stylus, which would etch the motion of the membrane into a rotating mass of wax. The sound could be replayed by putting the stylus into the groove, and rotation of the wax would cause the stylus to shake as it followed the wavy groove and the membrane would transmit that motion back into the air producing sound. Nothing in that apparatus knows about frequency or sine waves. It is enough to record a time-history of the motion of the air/membrane/stylus.

The computer is simply recording the motion of a membrane in a microphone (perhaps the changing voltage of a piezoelectric transducer as it is deformed by the membrane, or the capacitance between a membrane and a plate as the motion of the air pushes them closer and further apart), then reproducing that motion in another membrane: a speaker (typically through electromagnetic actuation). If it samples the motion quickly enough, the collection of instants in time is indistinguishable from the original motion to human ears -- sort of like how video represents motion as a collection of still images rapidly played back. But, whereas the threshold for visual continuity is somewhere in the tens of hertz (frames per second), the threshold for audio continuity is in the tens of thousands of hertz (sample rate).

In high school, you would have learned about audio in a continuous context. The textbook is discussing it in a discrete context. It's no surprise you found it confusing: if you had continued through college studying acoustics, you probably would have taken more than one course teaching you the math behind analysing discrete representations of signals. It's a big topic!

lvnsn
  • 41
4

There are many great answers but since I really love this subject, I want to take an approach from the physical notion of sound wave, with the intention to complement the other great answers.

Sound is a physical phenomenon caused by the vibration of an object that causes particles of the medium (usually air) to generate longitudinal waves. These waves propagate in all directions from the source of the sound (vibrating object), and these affect the normal atmospheric pressure, creating changes in atmospheric pressure over time, thus, generating a waveform. These changes are what we perceive as sound, they carry all information of the sound. So if you wanted to reproduce a specific sound, all you would need is to reproduce/imitate those changes of pressure over time, neither more or less.

So, let say a sound is being generated in a fixed point $A$, and we have a microphone in another point $B$ near the source. This means that we are fixing a point in space and we are registering/measuring/recording those changes of atmospheric pressure we spoke about in the last paragraph.

enter image description here

Fuente de sonido (tono puro): Sound source (pure tone)

Presión atmosférica normal (silencio): Normal atmospheric pressure (silence)

Presión atmosférica máxima (PM): Maximum atmospheric pressure (PM)

Presión atmosférica mínima (Pm): Minimum atmospheric pressure (Pm)

Now we encounter technical difficulties, first, these changes in atmospheric pressure are continuous and computers and circuits can't deal well with a continuous magnitude, this is where the ADC, and sampling rate comes into play as well as the "Nyquist sampling criterion" niels nielsen spoke about.

So the idea is that your ADC has an infinity of options (pressure values over time), but we chose only certain instants of time with their respective pressure values, so basically, if we sample for example at 44.1kHz, what we are telling the ADC to do is the following: every $\frac{1}{44100}$ of a second I want you to register the value of the pressure level. So that every second we have 44100 values of the pressure in the instant $\frac{n}{44100}$ for $n \in \{1,2,...,44100\}$ <- this is how you obtain your digital sampled wave.

enter image description here

Finally you could say: ok, but where is the frequency here? Well, as I said, all you need is the waveform in order to capture all the information necessary to store and reproduce a given sound wave. The frequency analysis can be done later using only the waveform, through the awesome tools of Fourier analysis like the spectrogram.

César VB
  • 161
2

I mean, doesn’t the amplitude represent the loudness and the frequency the pitch?

Yes, the amplitude is how loud the signal is. But, a low pitch can be loud and a high pitch can have the same "loudness" (or volume level).

So there is something different between an equal volume high pitch and low pitch.

That difference is how fast the sound wave is changing from high to low. A high frequency's wave changes faster from high to low than a low frequency's wave.

How do computers store sound waves just by sampling the amplitude of a wave and not the frequency?

So sampling the signal's value allows us to not just see highs and lows (the loudness) but also how close together in time those highs and lows are (the frequency) - because we know how fast we sampled the signal.

And as others have noted, the minimum rate to sample a signal to accurately capture that signal's frequency is the signal frequency * 2.

CramerTV
  • 847
1

As others have explained, each sample has a value and a timestamp, and this provides the necessary information to perfectly reconstruct any band-limited signal where all its frequency components are below half the sample rate (the Nyquist frequency).

(This assumes infinite-precision samples and zero jitter in the sample timing. In practice, leaving some headroom in the sample rate and using 16-bit integer PCM samples makes it work very well for all signals a bit below half the sample rate. With dithering, the reconstruction part can even work ok for signal amplitudes down to less than 1 unit in the last place of your samples which would otherwise be lost to quantization.)

To get a feel for how this works, see it in practice with an analog signal generator, ADC, computer, DAC, and analog oscilloscope + spectrum analyzer. An excellent 23-minute video lecture, Digital Show and Tell by "Monty" Montgomery of xiph.org does this for you and explains what's going on in an easy-to-understand way that avoids and debunks some common misconceptions. It's very much worth your time. (Monty is the guy who developed the Ogg/Vorbis audio compression format, and was involved with Opus, as well as founding Xiph.org, so naturally the video is available in a variety of open formats :P.)

The ball-and-stick (lollipop) representation of the samples, and fitting a curve to them, is useful in understanding that a sample is taken at one instant, not a flat voltage across a whole time interval (i.e. a stair-step output). For signals anywhere near the Nyquist frequency, a stair-step model would be far from correct. (And not band-limited; a true stair-step has frequency components up to infinity, not band-limited.) Monty covers that in the first 8 minutes of his video.

Ball-and-stick samples with a sine curve reconstructed from them


P.S. yes, the main reason I wrote this answer was to link this videos. It's so good for building a qualitative understanding of the subject that IMO it's worth an answer, with enough of a text answer to sidestep the rules against link-only answers. I highly encourage everyone to watch if they're curious about the subject, or just want to enjoy a well-presented demo using real physical hardware by an expert in the subject. Subtitles are available in a few languages. There's also a transcript / text article version, https://wiki.xiph.org/Videos/Digital_Show_and_Tell with some math formatting and images where needed, including the one above.

Peter Cordes
  • 1,388
0

There whe several answers showing how the sound is transformed to a voltage signal. In fact there is only one sample variable vs time. So the signal can be harmonic with an amplitude and frequency. However, in general, the signal is whatever it is, it can be time limited, so a pitch or frequency is present during a certain amount of time. What is frequency and amplitude of this signal? There is a mathematic instrument called Fourier transform, which takes a time dependent signal and calculate it's frequency decomposition (there might be several pitches), for each frequency it gives an amplitude, so the result signal is a sum of those components. So, to sum up, the frequency and amplitude information is, kind of, included in the signal. What you need is only time dependent signal.

Pierre Polovodov
  • 750
  • 4
  • 19
0

Perhaps it might help to consider how sound is heard, and how it can be mechanically recorded a vinyl record.

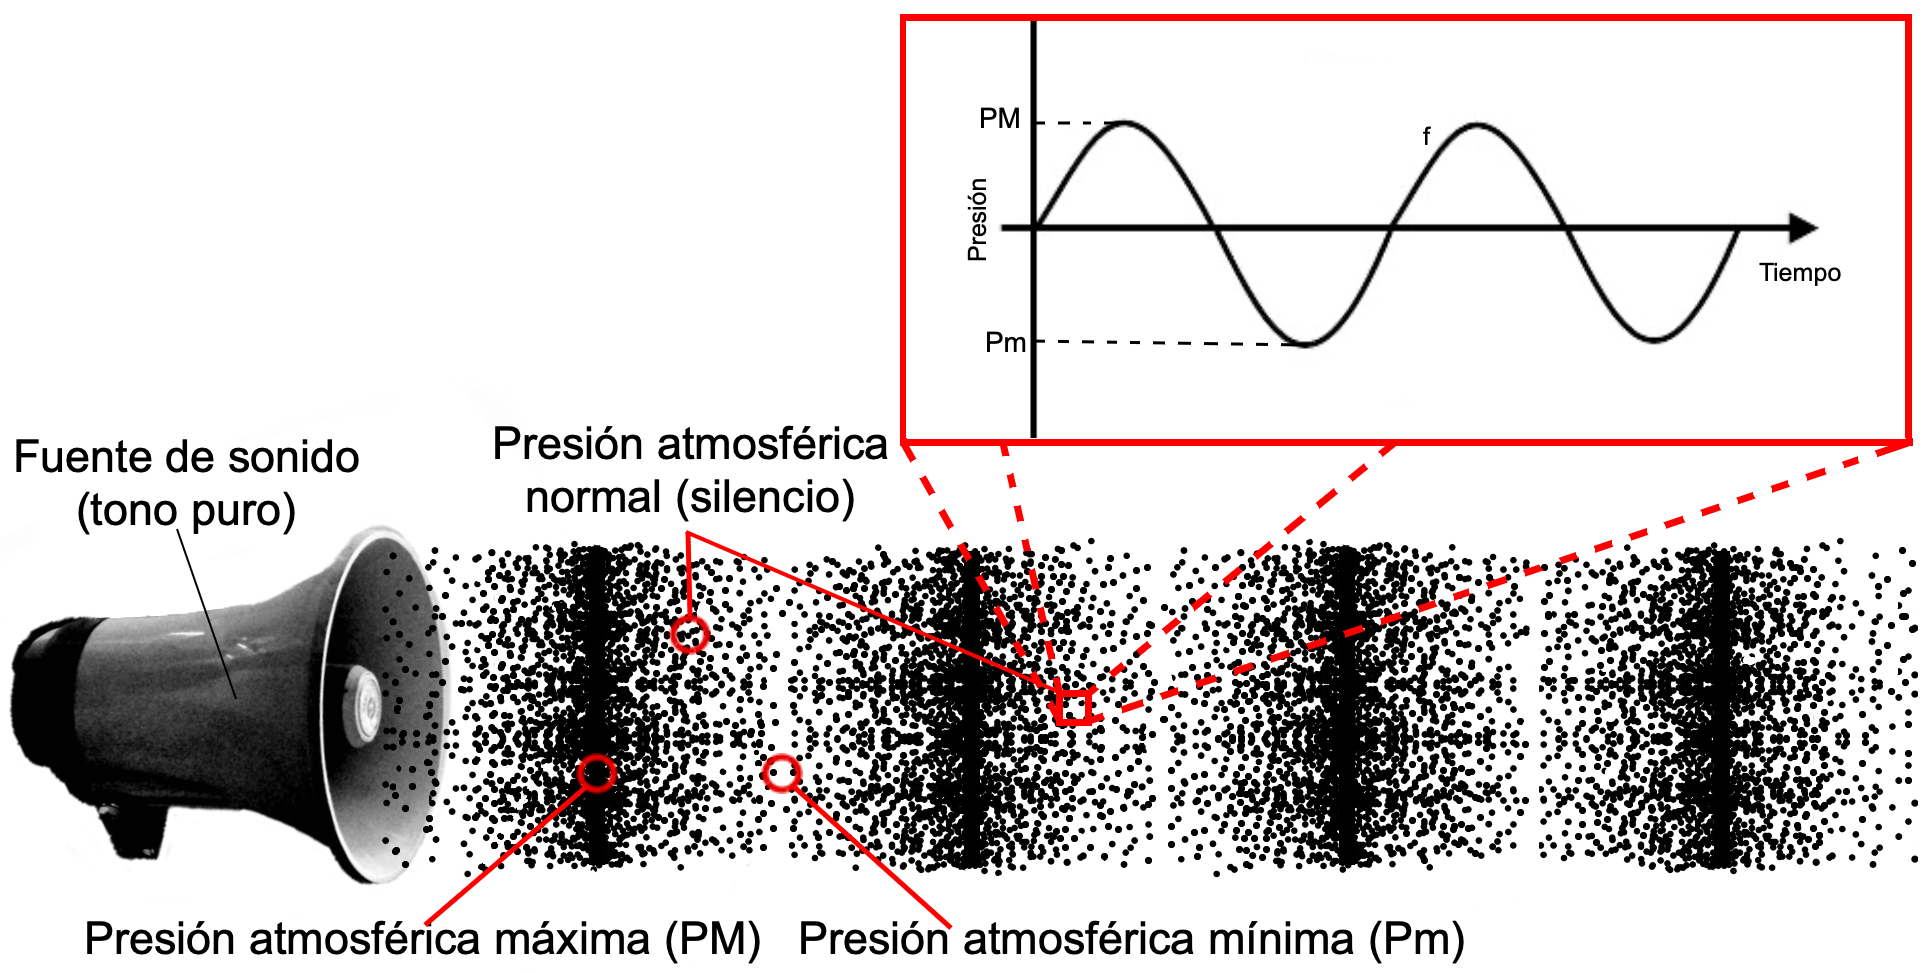
Sound is just the change of air pressure, measured at a point.

So, we hear by the diaphragm of our eardrum mechanically displacing in and out, pushed and pulled by soundwaves. This displacement is one-dimensional, like any drum-skin: in or out. How fast it wiggles in or out is the pitch. How far it wiggles in or out is the volume. But at any moment in time, our eardrum is only in one position, with a certain displacement from its rest position.

To record it mechanically on a vinyl record, we take the vibrations of a similar mechanical diaphragm, and connect it to a needle, which scratches a surface in a way that exactly reproduces those vibrations. Like a heart monitor or a seismograph, but for sound waves.

Only one wiggly line scratched into a surface stores all frequencies and amplitudes (pitches and volumes) of the sound. Well, OK, it can get a bit cleverer for stereo, but let's ignore that for now!

There isn't one line for each frequency: there's just one single wavy line, or "waveform". For any point in time, all that line has "stored" for all of the sounds in a musical recording, is the diaphragm's displacement from the rest position.

Just as with our eardrums, the displacement doesn't contain any information about frequency, or about what instrument was playing, or anything. Just "how loud that sound was, right then."

But the changing values of that one displacement value over time is how all the subtlety and nuance of a myriad different sounds in a music track are heard. All the instruments and singing, all stored in that one wavy line.

Are we exactly reproducing the sound, as it truly was? No, there will be elements of the sound that are too high-frequency to move the diaphragm, since the diaphragm has mass. But long as the diaphragm-and-needle combination is at least as sensitive to air movement as the diaphragm of the human eardrum, though, it'll reproduce enough of the sound to replay the whole spectrum of audible sound.

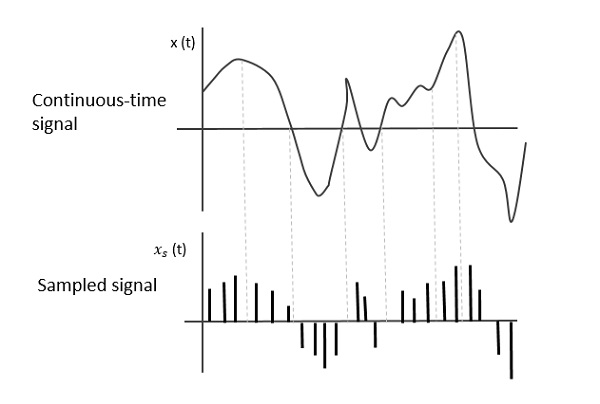
So, what if we want to store that wiggly wave as a sequence of discrete numbers?

We'd slice that wiggly line up into parts and write down the displacement at each point.

If we do it often enough, we should be able to send those values to control a speaker diaphragm to move forward and backwards by the amounts we'd recorded, and it'll move in the same path as the scratched line we recorded earlier.

How big should the numbers be, that we use to write down the displacement? Well, if we figure out the smallest change in displacement our recording equipment (or our ears) can detect, that should be the value of '1' our recording. Doesn't necessarily even need to be linear: maybe our ears don't respond linearly to changes in volume, in which case the volume difference between "0" and "1" can be different to that between "500" and "501".

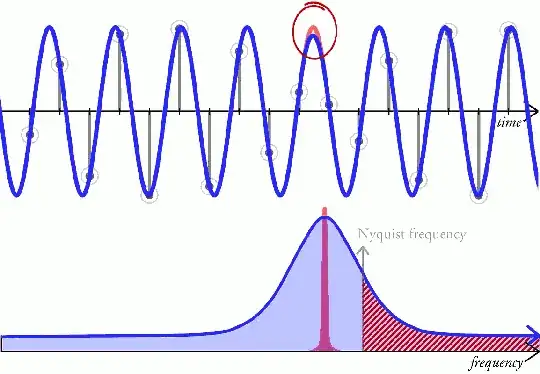
How often should we write the numbers down? Well, there's no point recording/sampling more often than the fastest the diaphragm (or our ears) can move between two adjacent numbers, since the values can't change more often than that.

Dewi Morgan
  • 647
  • 6
  • 15
0

Digital audio can be viewed the same way as analog audio. Which digital audio is a sampling of the amplitude over time. It is generally not instantaneous physically, because that would require an infinite sample rate. It is an averaged energy at a time delta of 1/sample-rate. You can learn more by looking into the sampling theorem.

If we take enough samples and look at them in a 2d graph in time and amplitude. (The time domain). We can see that the discrete samples will form a wave with height (amplitude) and width (wave length). The wave length in a sine wave is related to the wave's frequency.

If we add more waves of different frequencies (wave lengths) we can get more complicated waves and hear multiple frequencies. And we can move from the time-domain into the frequency-domain by transforming the samples using a discrete Fourier transform. This is a little complicated, but important in general for audio analysis. Needless to say frequencies of digital audio cannot be determined with one or two samples. We need multiple samples over time to measure a frequency.

Which is to say in order to hear a certain pitch the amplitude needs to be moving up and down at a given frequency, but amplitude alone is not a pitch.