You could try this one:
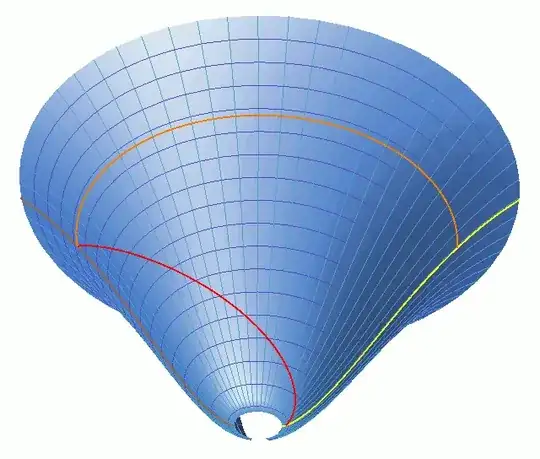
It's made by flipping the sign of the metric to $ds^2 = dt^2 + a(t)^2 dx^2$ and embedding that isometrically in 3+0 dimensions by
$$\begin{align} r & = a(t) R \\ \phi & = x / R \\ z & = \int \sqrt{c^2 - a'(t)^2 R^2} \, dt \end{align}$$
where $r,\phi,z$ are ordinary cylindrical coordinates and $R$ is a free parameter. The ΛCDM scale factor is well approximated by $$a(t) = \left[ \frac{1-\Omega_Λ}{\Omega_Λ} \sinh^2 \left( \frac32 \sqrt{\Omega_Λ} H_0 t \right) \right]^{\frac13}$$
and $Ω_Λ\approx 0.69$ and $H_0\approx 1/(14\text{ Gyr})$.
Good things about this embedding:
Distances along the parallels and time intervals along the meridians are correct everywhere on the diagram.
The edges of the light cones are angled at 45° to the parallels and meridians everywhere on the diagram.
Those properties mean that you can get numerically correct results for certain problems by visual inspection. The lines on the diagram are meant to show how light (red) from a quasar (yellow) that is now 28 Gly away (orange) can reach us (brown) in 12 Gly. You can verify those distances and times by counting the meridians and parallels, which are 1 billion [light] years apart. If you're careful, you can also get the correct cosmological redshift on this diagram by comparing the separation of nearby light paths at the emission and detection times.
Bad things about this embedding:
Diagonal distances aren't correct. (But that's unavoidable since any paper model lives in a space of 3+0 dimensions, and you can't isometrically embed 1+1 dimensions in 3+0.)
It looks like space wraps around at a distance of $2πRa(t)$, which it doesn't. (But any model with this general shape has that problem.)
It can't be extended all the way back to the big bang or indefinitely into the future. The representable time are those at which the square root in the integral doesn't go imaginary. Decreasing $R$ extends the time range, but limits you to smaller spatial distances. Extending back to the CMB era isn't feasible, unfortunately; it's far too early.
The picture from your question:
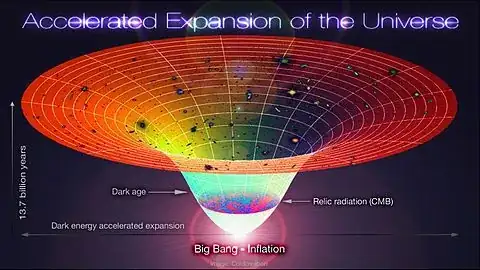
isn't numerically accurate. There's too much outward flaring at the top given that the top edge is supposed to represent the present time, according to the arrow on the left. The scale factor wasn't nearly that large in the CMB era, and the way the CMB map is shown to "fill" the cone makes no sense. Even drawing it as a ring on the cone would be wrong: it should be just two points when there's only one spatial dimension. And the way galaxies are drawn makes no sense—they should, of course, be lines/tubes, not isolated blobs. (And they're far too large.)
