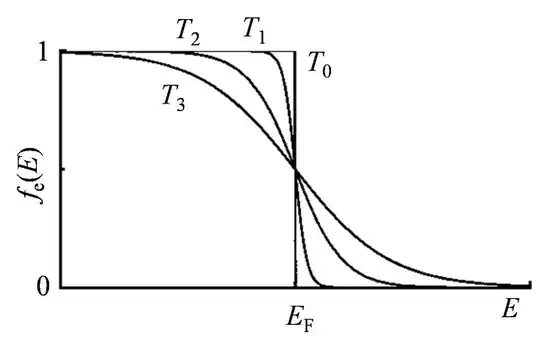
Is there a significance or an important interpretation of the fact that the plots in the Fermi-Dirac distribtion graph, all intersect at the point with coordinates ($\epsilon_F$,$\frac {1}{2}$)?
2 Answers
The curve shown in the image quoted in OP correspond to different values of temperature, but the same value of the Fermi level. It is a simple mathematical fact that the Fermi function $$ f_{\epsilon_F}(\epsilon)=\frac{1}{\exp\left(\frac{\epsilon-\epsilon_F}{k_BT}\right)+1} $$ takes value $1/2$ when $\epsilon=\epsilon_F$. What changes with temperature is the spread of the function about the Fermi level, which characterizes how many electrons from below the Fermi level have been excited to above the Fermi level.
See also this answer regarding the difference between Fermi energy and Fermi level.
- 68,984
To quote Wikipedia: "In band structure theory, used in solid state physics to analyze the energy levels in a solid, the Fermi level can be considered to be a hypothetical energy level of an electron, such that at thermodynamic equilibrium this energy level would have a 50% probability of being occupied at any given time."
States with low energy are always the most likely to be occupied, and states with higher energy are less likely to be occupied. The Fermi energy is the "balancing point" with 50% expected occupation.
- 1,615
