5

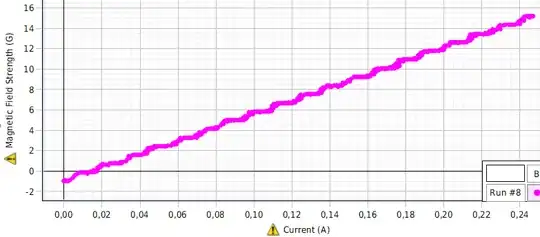
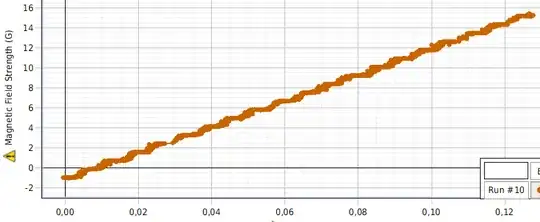
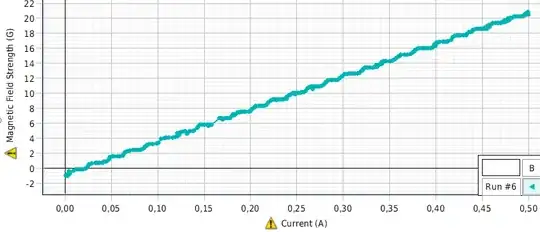
We were running current through a solenoid coil with an iron core, and measuring the resultant magnetic field strength. We expected a purely linear relation for the "current-field strength" graph.

However, our data resembles a stairway instead. Our measures plotted in a graph: data resembles a stairway with slanted stairs
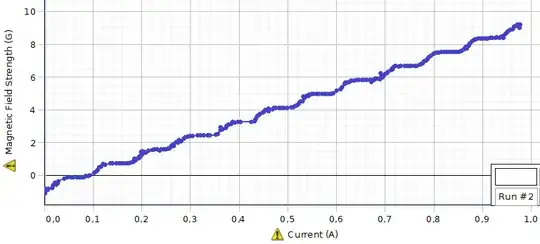
The plot refers to a solenoid with 400 windings (when using more windings we get more "steps") and can be accurately reproduced no matter what equipment we switch out.

We're completely stumped as to why we got this result. Our teacher has no clue and we haven't been able to find any resource on this effect.

Edit: Extra graphs 600 windings enter image description here
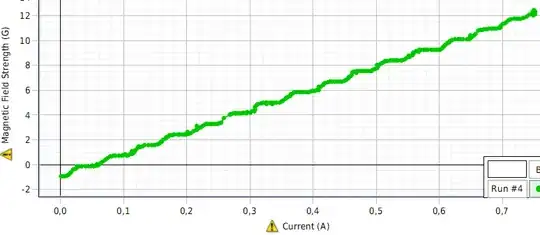
800 windings enter image description here

1600 windings enter image description here

3200 windings enter image description here

do note that the current axis is not the same for all of the graphs

If it's relevant to show how fast current was increased, here's current and time
1 Answers1

1

You should get a linear or smooth exponential change in field strength. Possible explanations would require a careful look at any features of the test setup such as frictional hysteresis; power source variations such as an autotransformer whose voltage is derived from coil turns in the transformer. As a clue, does each ripple represent a change in the applied current?; is the voltage well filtered to eliminate a.c. ripple (alternations in voltage can affect the core iron magnetic hysteresis and thus the field).

DaveM2
  • 11
  • 1