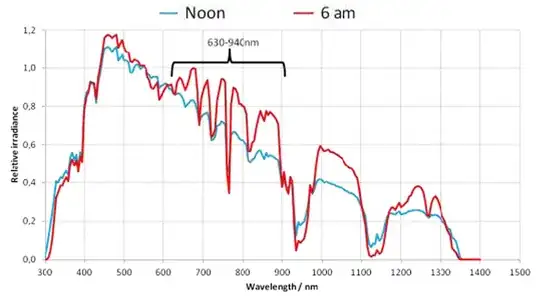
I am trying to get a good view of light wavelength distribution as a function of viewing angle, with a specific interest as $z \approx 90^\circ$ near the horizon (sunrise/sunset). Air mass coefficient values by viewing angle are well known and reasonably approximated, but what I cannot find is how wavelengths attenuate by air mass (for example, sunsets are red because blue is mostly adsorbed at the horizon).
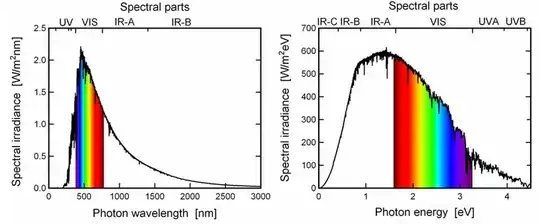
AM0 defines the spectral irradiance without atmosphere (ie, in space) and it looks like this:
(image source: Altermatt Lecture: The Solar Spectrum)
Question: How can I calculate the graph at "AM20" which is near the horizon using known AM0 data?
Given the AM0 spectra irradiance by wavelength (ie, from the ASTM G173-03 Reference Spectra), how can you approximate the resulting relative irradiance (or attenuation) as a function of wavelength and air mass coefficient? Mathematically, I'm looking for something that approximates this:
$ P^\prime(\lambda) = f(P(\lambda), AM) $
where:
- $ f() $ calculates the net irradiance adjusted for a given air mass coefficient. (Different wavelengths are adsorbed differently.)
- $ P(\lambda) $ is the irradiance in units of $ \frac{W}{m^2\cdot \lambda} $ (Wm-2nm-1) with an air mass coefficient of 0 (AM0) based on known values.
- $ P^\prime(\lambda) $ is the irradiance in units of $ \frac{W}{m^2\cdot \lambda} $ (Wm-2nm-1) after attenuating based on an arbitrary air mass coefficient.
- $ AM $ is the air mass coefficient for which we want to adjust.
(NB: I'm new to this topic, if this is the wrong place for such a question, then please point me at the right SE community so I can move the post. Thanks!)

