4

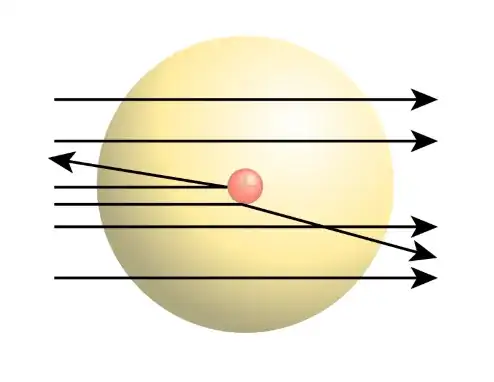
Rutherford's scattering experiment of the atom is qualitatively convincing just by the detection of near 180 degree deflection of positively charged alpha particles when shot through the dense lattice of solid atoms,

enter image description here

An experiment based on the same principle is conducted using accelerated electrons passed through the dense proton lattice of low temperature liquid hydrogen.

enter image description here

(https://users.hep.manchester.ac.uk/u/ukyang/fpp2/dis/dis_lec1.pdf)

I am having trouble following the chart above.

enter image description here

(https://cerncourier.com/a/picturing-the-proton-by-elastic-scattering/)

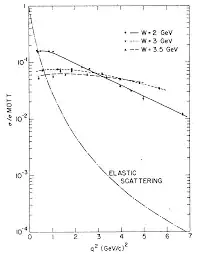
1. What is being plotted on the x-axis, and what is plotted on the y-axis?

2. How does the three regression lines calculated from the detection prove that there are 3 constituents having differing charge sign and magnitude, within this large 3D repeating proton lattice of liquid hydrogen?
James
  • 637

1 Answers1

9

The graph you show is originally Fig. 1. in the 1969 paper "Observed behavior of highly inelastic electron-proton scattering" [pdf link] by the SLAC collaboration. It plots total momentum transfer $q^2$ - the square of the absolute value of the difference between the ingoing and outgoing electron momenta - against the ratio of the observed cross section $\sigma$ against the theoretical cross section $\sigma_\text{Mott}$ for Mott scattering where the nucleus (in the case of hydrogen just a single proton) is a point without substructure.

It shows three different plots at different $W$, which is the rest mass of the "recoiling target system", i.e. the products of the inelastic scattering reaction, and also for comparison how elastic scattering would look like in this graph. The lines drawn are just there to "guide the eye" [direct quote from the authors] and are emphatically not regression models or other fits. This is experimental data not yet tied to a specific theoretical model.

The presence of exactly three plots in the graph is an accident of what kind of data they collected/chose to draw, this data tells us in no way that there are exactly three quarks in a proton. What this does tell us is that the proton is not a point-like particle without substructure and it allows for estimates of the form factors. If you read the original paper you'll see that they discuss various theoretical models - some involving quarks, some not - and do not end up choosing one as the definitive explanation, among other things because the data is too weak to determine the proton form factors fully.

ACuriousMind
  • 132,081