A continuous wave signal of 'f' kHz will appear on a receiver plot tuned in at f kHz and nothing else, ie it is 1 Hz wide. However, apparently this is not the case with pulsed signals and I'm struggling to understand why. Apparently, even if the transmitted pulses all have a consistent frequency, eg pulses containing a f kHz signal, and these pulses are transmitted at consistent intervals, the received signal does not appear as a narrow vertical line 1 Hz wide, but rather as a "band" with a main lobe, the centre of which would be our f kHz signal, extending to x kHz below and x kHz above it (the distance between the two being the pulse's bandwidth), and with a succession of higher and lower frequency lobes also extending out.
My textbook seems to be implying that the reason for this is because of the lower average power of a pulsed signal vis-a-vis a CW signal at the same frequency (because of the time that the transmitter is "off"):
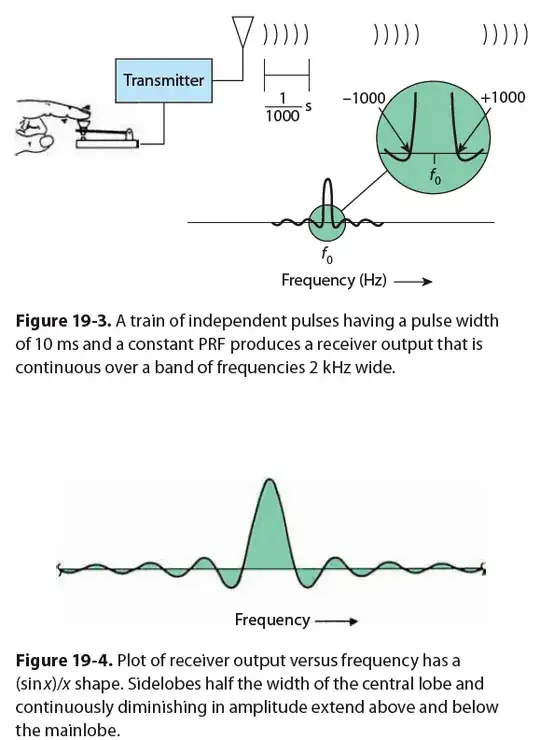
Because of the signal’s lower average power (the transmitter is “on” only a fraction of the time, whereas before it was on all the time), the receiver output is not as strong as before, but it still occurs at the same point, $f_0$, on the dial. However, the plot of receiver output versus frequency is not quite as sharp as before. In fact, when expanded, it is continuous over a band of frequencies extending from 1 kHz below $f_0$ to 1 kHz above it. In other words, the null-to-null bandwidth is 2 kHz.
But I cannot understand why this would allow us to detect the original signal at 1 kHz above or below it (if this is indeed what it is suggesting).


