If you want to talk about black hole singularities at a level beyond a pop-sci documentary, then some fundamentals of GR need to be firmly established ahead of time.
Let's assume that all matter travels along $t$ axis roughly at the speed of light, in the direction of worldline for rest mass.
There is no $t$ axis. All massive particles travel along their worldlines, which are determined by the spacetime geometry and any forces which they might be subjected to. If you focus on a given massive particle, then you can construct a coordinate system $x$ (perhaps only in a small neighborhood of its worldline) such that its trajectory is $x(\tau) = (c\tau,0,0,0)$ - which you could loosely describe as the particle traveling along the $x^0 \equiv ct$ axis. However, there is no unique way (and in general, no way at all) to extend this coordinate system to cover the entire spacetime.
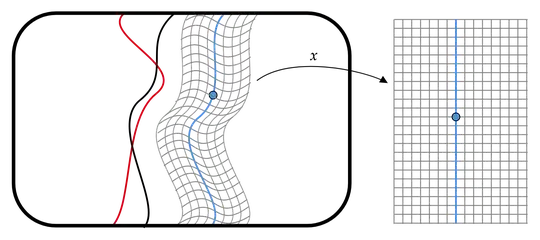
In the cartoon below, I've drawn three worldlines (black, red, and blue), and defined a coordinate chart $x$ in a neighborhood of the blue worldline. The grid on the right represents the coordinate chart, in which the blue worldline is simply a straight vertical line along the $x^0\equiv ct$ axis.
Let's also assume that there is a singularity (or other sufficiently compact object) formed by collapse of neutron star of sufficient mass. It has an event horizon around it.
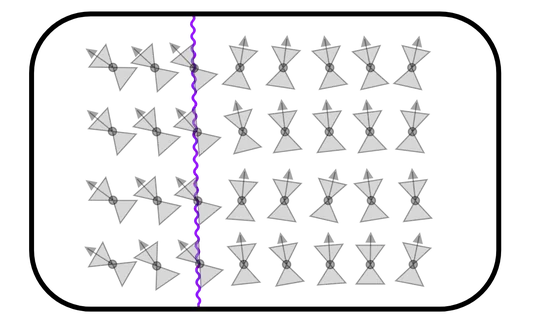
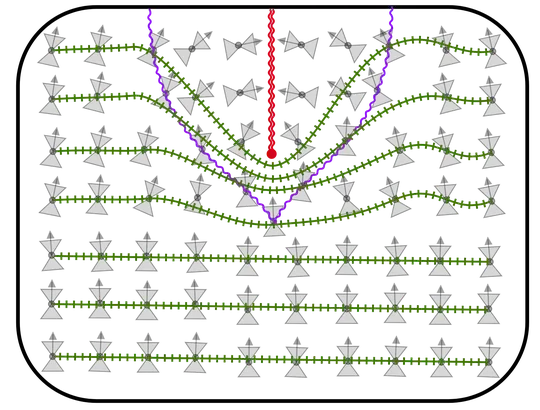
The local spacetime geometry can be diagrammed by attaching the light cone to each spacetime point. In such a diagram, an event horizon is characterized by all of the forward light cones along the horizon pointing inward. In the cartoon below, the forward light cones are specified by the arrows, and the horizon is denoted by the squiggly purple line.
In particular, a spacetime with a black hole might look like this, with the singularity denoted by the red double squiggle:
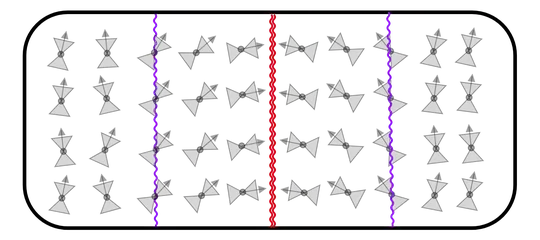
Note that unlike the event horizon, the singularity is not a point (or set of points) in the spacetime. It is not a part of the spacetime at all, in much the same way as the hole in a punctured sheet of paper is not part of the paper.
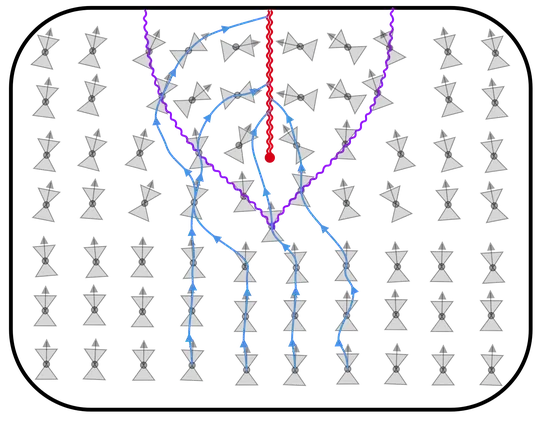
Here's another cartoon - this time of a black hole which forms due to gravitational collapse, and a few worldlines of in-falling matter (note: not necessarily in free-fall) shown in blue.
Having dazzled you with spacetime diagrams, we can now address your main question.
Should we assume that this singularity also travels along the same t axis that the matter around singularity experiences?
As may be clear from the diagrams, this question doesn't really make sense. There is no unique $t$-axis, and the singularity is not even a part of spacetime. Furthermore, once you get inside the horizon, every timelike curve terminates at the singularity and so to the extent the singularity is anything, it is more akin to a moment in the future than it is to a point in space - loosely, the singularity does not consist of a worldline along some $t$-axis, but rather the place where every possible $t$-axis (inside the horizon) ends.
To make that point more clear, we can decompose the spacetime into spacelike surfaces of simultaneity, which I'll denote in my next cartoon with ticked green lines. Whenever you assign a spatial position to a point in spacetime, what you're (perhaps implicitly) doing is decomposing the spacetime into such a family of surfaces. Each surface is to be understood as a representation of space (not spacetime) at a given instant; the fact that the set of such surfaces is highly non-unique is what we mean when we say that there is no universal sense of simultaneity (or "now") in GR.
Okay - but then, how would the star-forming black home moving at 0.15 c would look like on such chart? The one mentioned in the article linked by another answer.
Let me try to provide some clearer interpretation for the cartoons. The diagrams which I've drawn up to this point (with the exception of the first one) make no reference whatsoever to any coordinate systems, or to the observations of any hypothetical observers. The naïve, 2D geometry of the various features I depicted - e.g. the fact that the singularity is a vertical line - is an artifact of how I drew the cartoon, and does not have a physical interpretation. You could imagine drawing my cartoons on an elastic sheet, and cutting the singularity away with a pair of scissors. You may squash or twist the remaining sheet however you'd like - the physical spacetime being depicted remains unchanged. The fact that the singularity is not actually a part of the spacetime means that it doesn't have a particular shape, size, or position.
If we assign coordinates to the spacetime, then we can get a better sense of what an observer might actually see or experience by interpreting those coordinates physically. This is perhaps the trickiest part of GR, at least for beginners.
In the following picture, I have diagrammed the formation of a black hole by in-falling matter, which I depict by a gray region. Below the spacetime diagram, I show a spacelike slice (green) which is to be interpreted as a snapshot of the spacetime at $t=0$, long before the formation of the black hole.
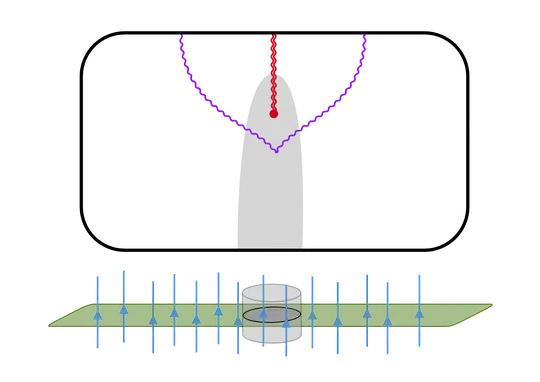
We may assign coordinates to our spacetime in the following way. First, we populate our $t=0$ slice with (massless) graduate students whose velocity along the slice is zero; their worldlines are depicted in blue. Observe that the of the (gray) in-falling matter is initially at rest with respect to our students. The green slice is the set of events where all of their wristwatches read $t=0$.
We then allow the system to evolve. The next slice will be the set of events where all of the wristwatches read $t=1$, then $t=2$, and so on. By doing this, we decompose our spacetime into slices (along which all of the graduate students' watches are synchronized).
Every event in the spacetime lies on one of the graduate students' worldlines. The time coordinate for that event will be the time on the corresponding graduate student's wristwatch, and the spatial coordinates for that event will be the graduate student's initial position on the $t=0$ slice.
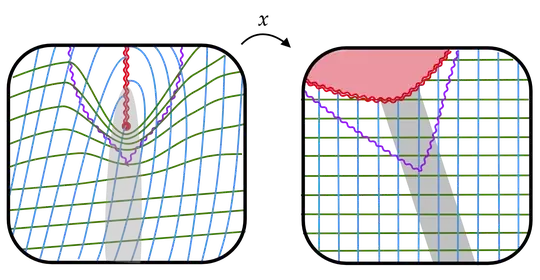
As the black hole forms, our slices become "deformed" due to kinematic and gravitational time dilation. The evolution of the spacetime is shown on the left side of the following figure, and the corresponding coordinate chart is shown on the right.
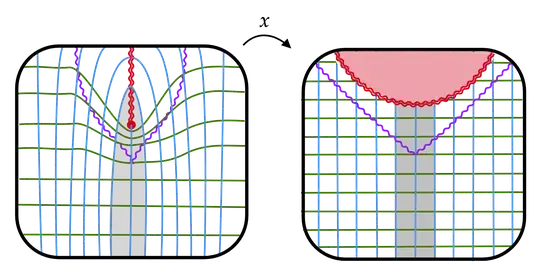
The region in red is not part of the coordinate chart (or indeed, part of the spacetime itself). We see that the singularity is the place where the worldlines of our unfortunate graduate students end. It is not a point in space; rather, for a given graduate student, the singularity is to be understood as a moment in time. For those graduate students who enter the event horizon, avoiding the singularity is like us avoiding next Wednesday.
Because the red double squiggle is not even a part of the spacetime, we cannot meaningfully assign it coordinates. We can, however, discuss the coordinates of the event horizon (shown in purple). At any given time (i.e. along any green slice), we observe that the event horizon constitutes the surface of a sphere, which is centered at a point which does not move as time goes on. In that precise sense we can say that in these coordinates, the black hole is at rest.
If we want to see what a moving black hole looks like, we can repeat the above procedure with a different initial slice. This time, we will choose a slice and a cohort of graduate students in such a way that the initial distribution of in-falling matter is not at rest, but rather moving to the left:
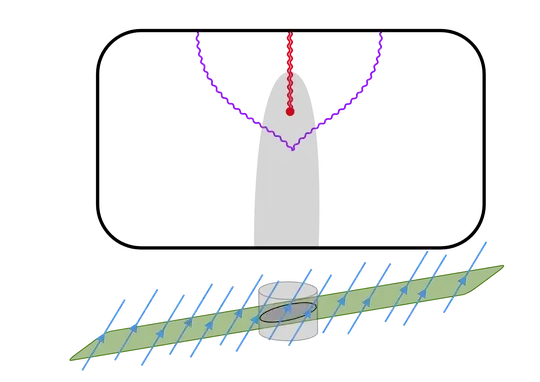
Decomposing our spacetime into slices and assigning coordinates like before, we obtain the following result:
This is what a moving black hole looks like. We see that the "central point" of the event horizon is moving to the left with the same speed as the initial distribution of in-falling matter.


