I'm having trouble understanding what the current voltage characteristic of a Josephson Junction looks like.
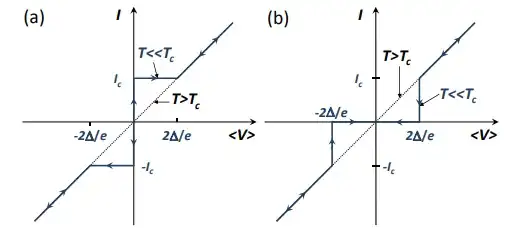
When we first looked at the voltage state of a Josephson Junction we got the following graph:

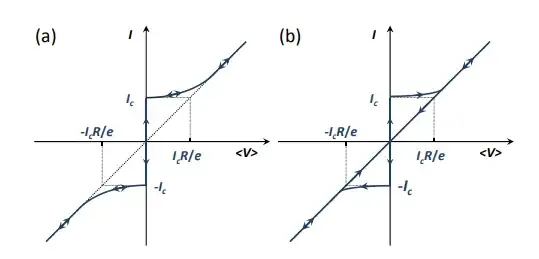
After that we analysed the RCSJ model and we got this graph:

Where a) corresponds to an overdamped Junction and b) to an underdamped one.
My question is: when do we get a graph like the first one as opposed to the second one?